Two virtual private servers can carry identical specification sheets, cost within a dollar of each other, and still differ several times over in production. The same four vCPUs and eight gigabytes of memory can deliver a comfortable margin on one platform and a queue of timed-out requests on another. Nothing on either product page explains why, because a specification sheet is a contract with gaps in it, and most of what decides your application’s performance sits on the far side of a boundary you cannot see from inside your own machine.
That gap is the subject of this article. Rather than listing plans, we work through the method an engineer should apply before and after signing up: what each number commits the provider to, how to measure what you were really given, how to profile a workload so the plan fits the application, and when the sensible move is a bigger server rather than more of them. The examples use N6 Cloud’s tiers because concrete numbers beat abstractions, but the method applies to any provider.
What You Are Actually Renting
A VPS is a guest operating system running on a hypervisor, with its own kernel and resource limits enforced by the host. If you want the fundamentals of that layer, our server virtualization guide covers hypervisor types, virtualization techniques and host architecture in depth. This article starts where that one leaves off, at the point where you stop being the person who builds the platform and become the person renting a slice of it.
That change of position matters more than it appears. As a tenant on a KVM-based platform such as N6 Cloud’s, you get a true hardware-virtualized machine: your own kernel, your own memory space, and the freedom to load modules, tune sysctl values and run whatever you need. What you do not get is visibility. From inside the guest, you can observe your own symptoms in detail, but not how many guests share your host, what density target the provider works to, or which processor generation you landed on if the CPU model is masked for live migration.
This asymmetry is why specification sheets need to be interpreted rather than read. Every number describes an allocation, and an allocation is a promise about how the host will behave under contention. Some of those promises are firm, and some are best-effort, but the product page rarely distinguishes between them. The rest of this article answers three questions: what does the sheet promise, what did I actually receive, and what does my application need.
Diagram showing what a VPS tenant can and cannot observe from inside the guest operating system
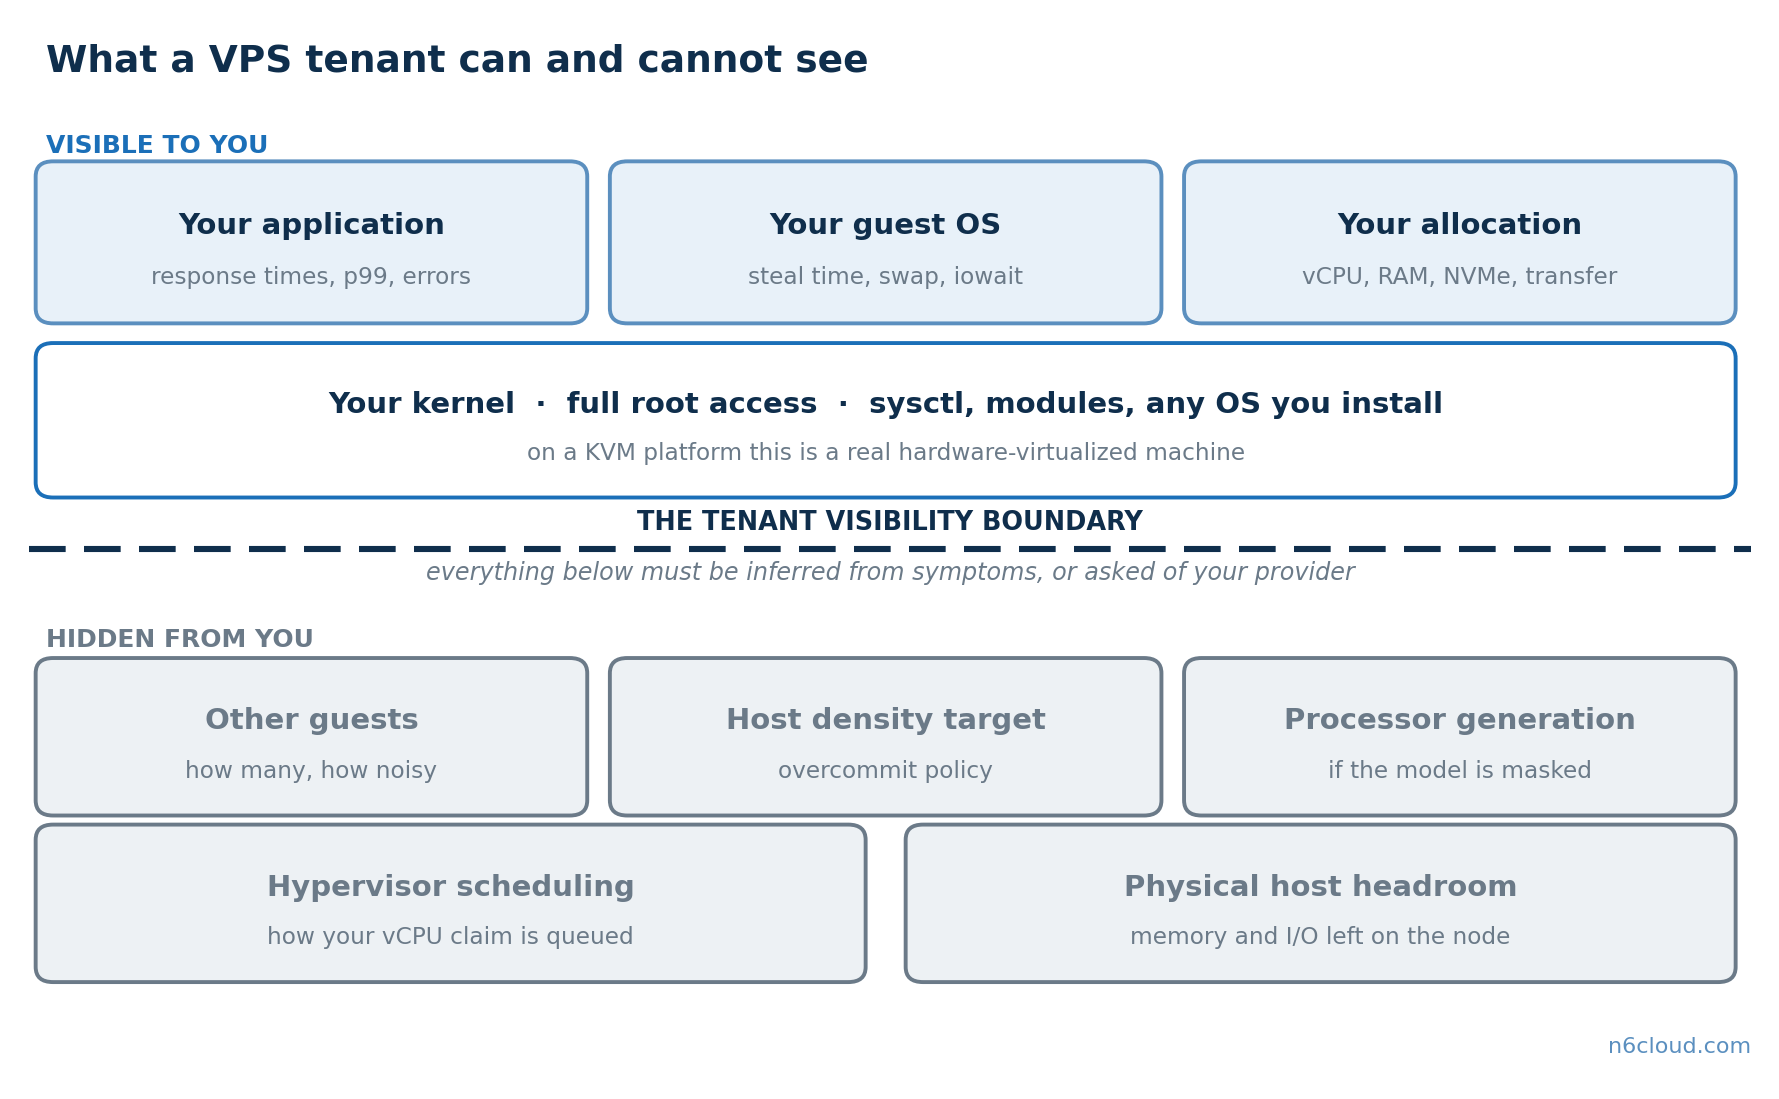 Figure 1: The tenant visibility boundary. Everything above the line is measurable from inside your guest. Everything below it must be inferred or requested from the provider.
Reading a VPS Specification Sheet: What Each Number Guarantees
vCPU is an entitlement, not a core
A vCPU is a scheduling entitlement rather than a piece of silicon reserved for you. The hypervisor presents a virtual processor, then schedules it onto physical cores alongside every other guest on the node. Even on a quiet host, the mapping matters because many providers back a vCPU with a hardware thread rather than a full core, so four vCPUs on two SMT cores deliver closer to 1.3x the throughput of a single core on CPU-bound work. On a busy host, they behave like four claims on a contended resource, and the difference shows up in tail latency long before it appears in averages.
What matters commercially is whether the entitlement is guaranteed or burstable. A guaranteed allocation means the scheduler delivers your share over each scheduling period, though even pinned vCPUs contend for shared cache and memory bandwidth. A burstable allocation means you may exceed a baseline when capacity is free and get throttled when it is not, which is reasonable for development work and quietly disastrous for a payment endpoint. Ask which model applies, then verify it with the measurements in the next section.
Memory, and the symptoms of getting less than you think
Memory is the most literal number on a specification sheet, though it still repays attention. The distinction is again dedicated against burstable, because a guest whose memory can be reclaimed under host pressure behaves very differently from one whose allocation is fixed. The symptom to watch is not swap, which is far more often caused by your own memory growth than by anything the host did. On KVM, the mechanism is the balloon driver, which inflates inside your guest, so check whether virtio_balloon is loaded and track MemTotal in /proc/meminfo: a host reclaiming memory from you will shrink it visibly. Most reputable providers do not overcommit memory at all, which makes this rarer than vCPU contention.
As a planning rule, roughly two gigabytes per vCPU suits general web and application workloads, while database-heavy instances want four or more so the working set stays in cache. N6 Cloud’s tiers span both shapes, from one-to-one configurations at the entry level up to 12 vCPUs with 24 GB of RAM, so the ratio can match the workload.
Storage: where the biggest gap hides
Storage is the specification most likely to decide whether an application feels fast, and the one buyers scrutinize least. Published comparisons of server SSD interfaces put enterprise NVMe drives past 650,000 random-read IOPS at high queue depth across several threads, while SATA saturates near 95,000 because AHCI offers a single 32-command queue compared to NVMe’s many. End-to-end device latency runs around 80 to 120 microseconds for NVMe, compared to 120 to 200 for SATA, and most of that advantage is due to protocol overhead rather than the flash itself. In application terms, sysbench-style MySQL testing shows throughput gains approaching 3.8x, with markedly lower 99th-percentile latency, although that gap narrows sharply once the working set fits within the InnoDB buffer pool.
Queue depth is why those numbers diverge so sharply. With a single request in flight, the two interfaces are nearly identical, because flash media latency dominates and the interface barely matters, but real applications do not behave that way. A database serving concurrent connections generates deep queues, and NVMe’s parallelism is built for that pattern while SATA’s single command queue is not. This is also why storage rarely shows up in average response time: it surfaces at the 99th percentile, in the fraction of requests arriving when the queue is deepest, which is precisely the fraction your users complain about. Every N6 Cloud VPS tier uses NVMe rather than offering it as an upgrade; when evaluating other providers, check whether “SSD” means NVMe or SATA, because the word covers both. One qualification applies to every figure above: they describe bare drives, and no tenant will measure them. The virtualization path, shared storage and provider rate caps all sit between you and the device, so treat these as interface classes rather than targets.
Bar chart comparing NVMe and SATA SSD random read IOPS at queue depth 1 and queue depth 32
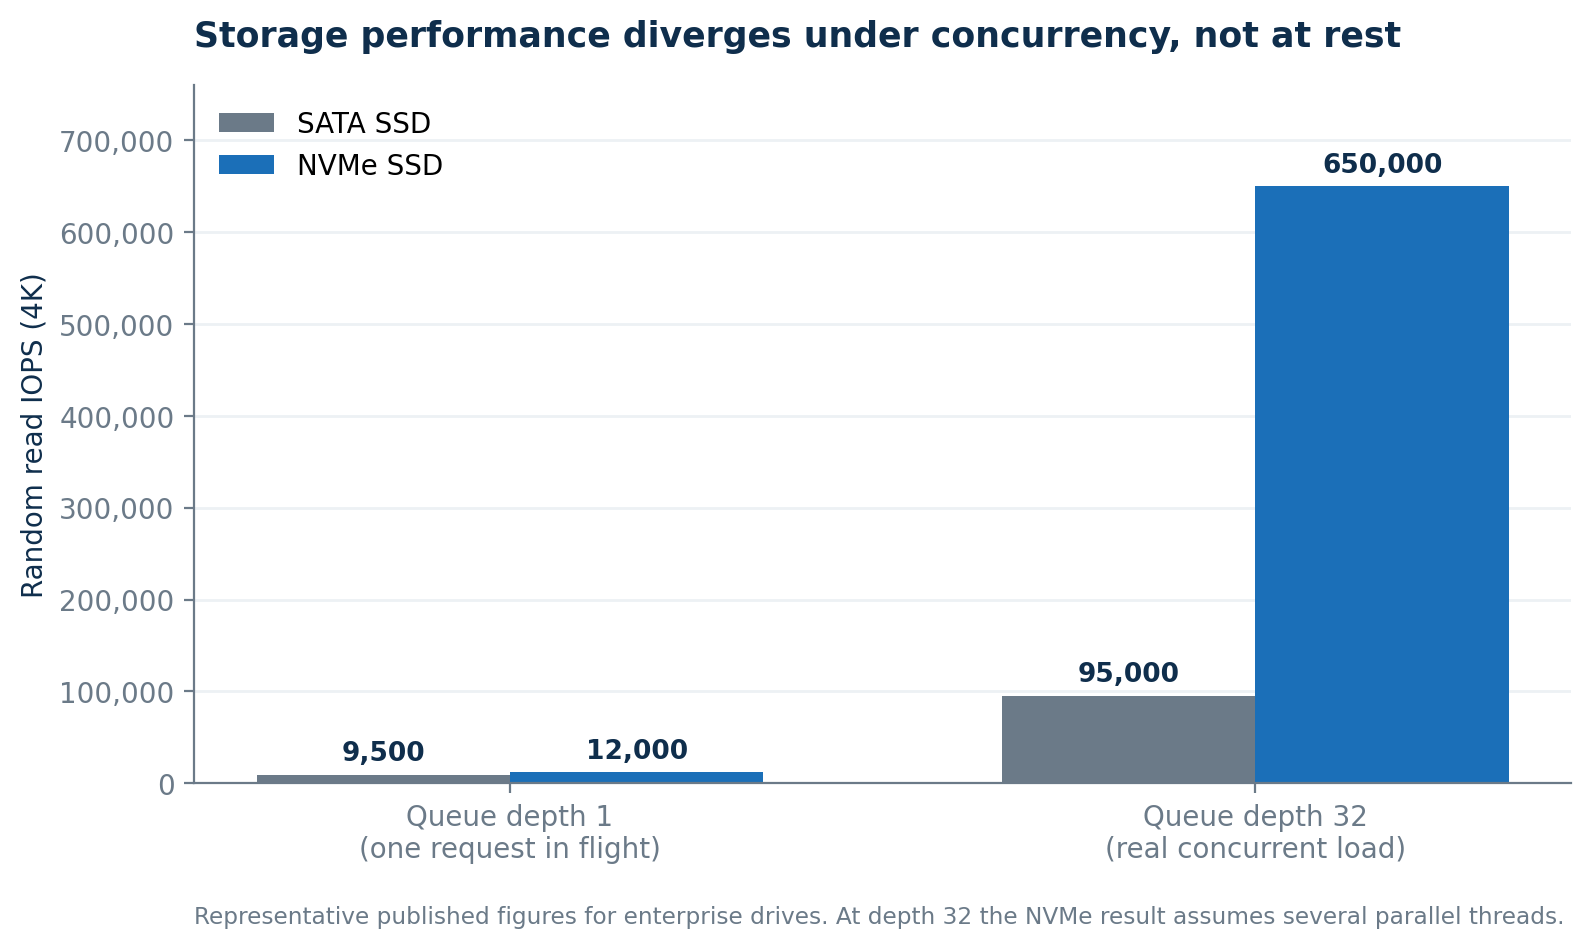 Figure 2: Random-read IOPS for NVMe against SATA SSD. The interfaces are comparable when a single request is in flight, but diverge sharply under the concurrency that real applications produce.
Bandwidth means two different things
No word on a VPS specification sheet causes more confusion than bandwidth, because vendors use it for two unrelated measurements. The first is your monthly transfer allowance, quoted in gigabytes or terabytes. The second is port speed, the rate at which you can move it, quoted in megabits or gigabits per second. A generous allowance on a slow port lets you serve a great deal of traffic slowly; a fast port with a small allowance serves it quickly until the allowance runs out.
N6 Cloud publishes transfer allowances from 500 GB up to 12 TB, which is the specification most website workloads are actually constrained by. When comparing providers, ask for both numbers, and treat “unmetered” with care: it almost always sits alongside a fair-use clause, and the meaningful question is what happens at that threshold, whether throttling, an overage charge, or a conversation.
Table 1: What each specification really tells you
 Measuring What You Actually Got

Everything above is a vendor’s claim. This section is how you test those claims from inside your own instance, with tools that ship with any Linux distribution and no access to the host. Run them during a trial period rather than after a problem appears, because a baseline from a healthy system makes a later anomaly obvious.
CPU steal time
Steal time is the percentage of intervals in which your virtual processor had work ready to run, but the hypervisor was busy servicing another guest. It is the most useful number available to a tenant, because it reports contention you did not cause, with one exception: on a burstable plan, quota throttling is accounted as steal too, so a capped instance can steal from itself. VMware administrators track a related host-side counter called CPU Ready, and on KVM the equivalent is scheduler run-queue delay. Steal is the guest-visible expression of the same contention, and it is the version you can actually see.
Read it from the st column in vmstat 1, discarding the first line because it averages since boot, or from %st in top. The counter in /proc/stat reports cumulative jiffies rather than percentages, so you will need deltas. Interpretation is about persistence rather than peaks: below two percent, ignore it; between two and five, investigate if tail latency matters; sustained double digits means you are paying for capacity spent on somebody else’s workload. One blind spot is worth knowing: a reading of zero does not prove the host is quiet, because steal accounting depends on paravirtual clock support and guests on some platforms report zero regardless of load.
Storage
Storage claims are the easiest to test and the most frequently untested. A short fio run reports the random-read IOPS your instance actually delivers at a defined queue depth:
Profiling Your Workload Before You Choose a Tier
The usual buying order is backwards: most people pick a plan, deploy onto it, and discover the constraint later. Characterize the application first, because almost every workload is limited by one resource rather than all three, and knowing which one turns tier selection from guesswork into arithmetic.
Consider a Node.js API behind Nginx with PostgreSQL on the same instance, running comfortably at around 40 requests per second on a 2 vCPU, 4 GB tier, until a campaign triples sustained traffic. The instinct is to assume CPU binds first, and for a compute-light JSON API it almost never does. What binds first is the database, though not in the way people expect. Every concurrent connection spawns a backend process holding several megabytes of its own memory, so connection pressure consumes memory before query volume does. Once the data set outgrows what shared_buffers and the kernel page cache hold between them, reads reach the device and queue behind one another. Latency degrades at the 99th percentile, while the average barely moves, which is why the dashboard looks healthy even as customers complain. The first fix is usually a connection pooler such as PgBouncer rather than a larger server; when the working set itself has outgrown memory, the answer is more memory rather than more cores, which, on N6 Cloud’s lineup, means the 4-8G-120 or 8-16G-320 path.
A WooCommerce store behaves differently. Each PHP-FPM worker consumes a variable footprint bounded by memory_limit, so pm.max_children must be sized based on measured average resident memory, net of the opcache shared across all workers. Raising the worker count without the memory to support it produces swapping, which is worse than the queueing it was meant to relieve. Concurrency is then capped by whichever binds first: memory, the CPU cost of generating uncached pages, or the database connection limit. The diagnostic signature differs in every case, which is what makes profiling worth the hour it takes.
Table 4: Mapping workloads to tiers
Grow Up or Grow Out: The Economics of Scaling
When an instance runs out of room, you can make it bigger or add another beside it. The decision is presented as a technical one but is more often an organizational one, because the two paths ask very different things of the team that maintains them. Vertical scaling wins on simplicity. When you change a tier, the resources appear, and nothing about your architecture changes. On N6 Cloud, that is a portal operation with minimal downtime and no migration. Two limits apply. You remain on a single physical node, so a node maintenance window is your maintenance window unless you designed around it. And like most providers, N6 Cloud supports upgrades but not downgrades, because reducing allocated resources risks the stability of a running system; the path runs one way, and it pays to grow in deliberate steps.
Horizontal scaling wins on resilience and, at the top of the range, on cost. Three 4-8G-120 instances behind a load balancer cost roughly $46 per month, compared to $79.46 for a single 12-24G-480 instance, with the same 12 vCPUs and 24 GB of aggregate memory. The arithmetic looks decisive until you read it carefully. Aggregate memory is not usable memory: no single process can exceed 8 GB, so a 12 GB buffer pool is impossible, which runs counter to the memory-bound workloads described above. Storage and transfer do not match either: 360 GB vs. 480 GB and 6 TB vs. 10 TB. And three nodes sized to meet your load cannot lose one, so real redundancy means a fourth instance, which erodes the savings. Session state must also be persisted to a shared store, deployments must reach every node, and someone has to own the load balancer. For a team with the maturity to carry that, horizontal is usually the better answer above roughly the 8 vCPU mark. For a small team running one application, a larger single instance is often the more sensible use of limited attention.
Two limitations apply industry-wide and deserve to be stated plainly. Backups are typically an optional add-on rather than a default, at N6 Cloud as elsewhere, so a VPS is not a backed-up environment until you make it one. And hardware transparency varies: lscpu often names the exact model, but where the CPU is masked for migration compatibility, it will not, so ask in writing if processor generation matters. When neither scaling option fits, the answer is a different product. Workloads that need private networking between many instances or on-demand elastic capacity belong on cloud servers, and workloads that need the whole machine belong on dedicated servers.
Decision flow diagram for choosing between vertical and horizontal scaling of a VPS
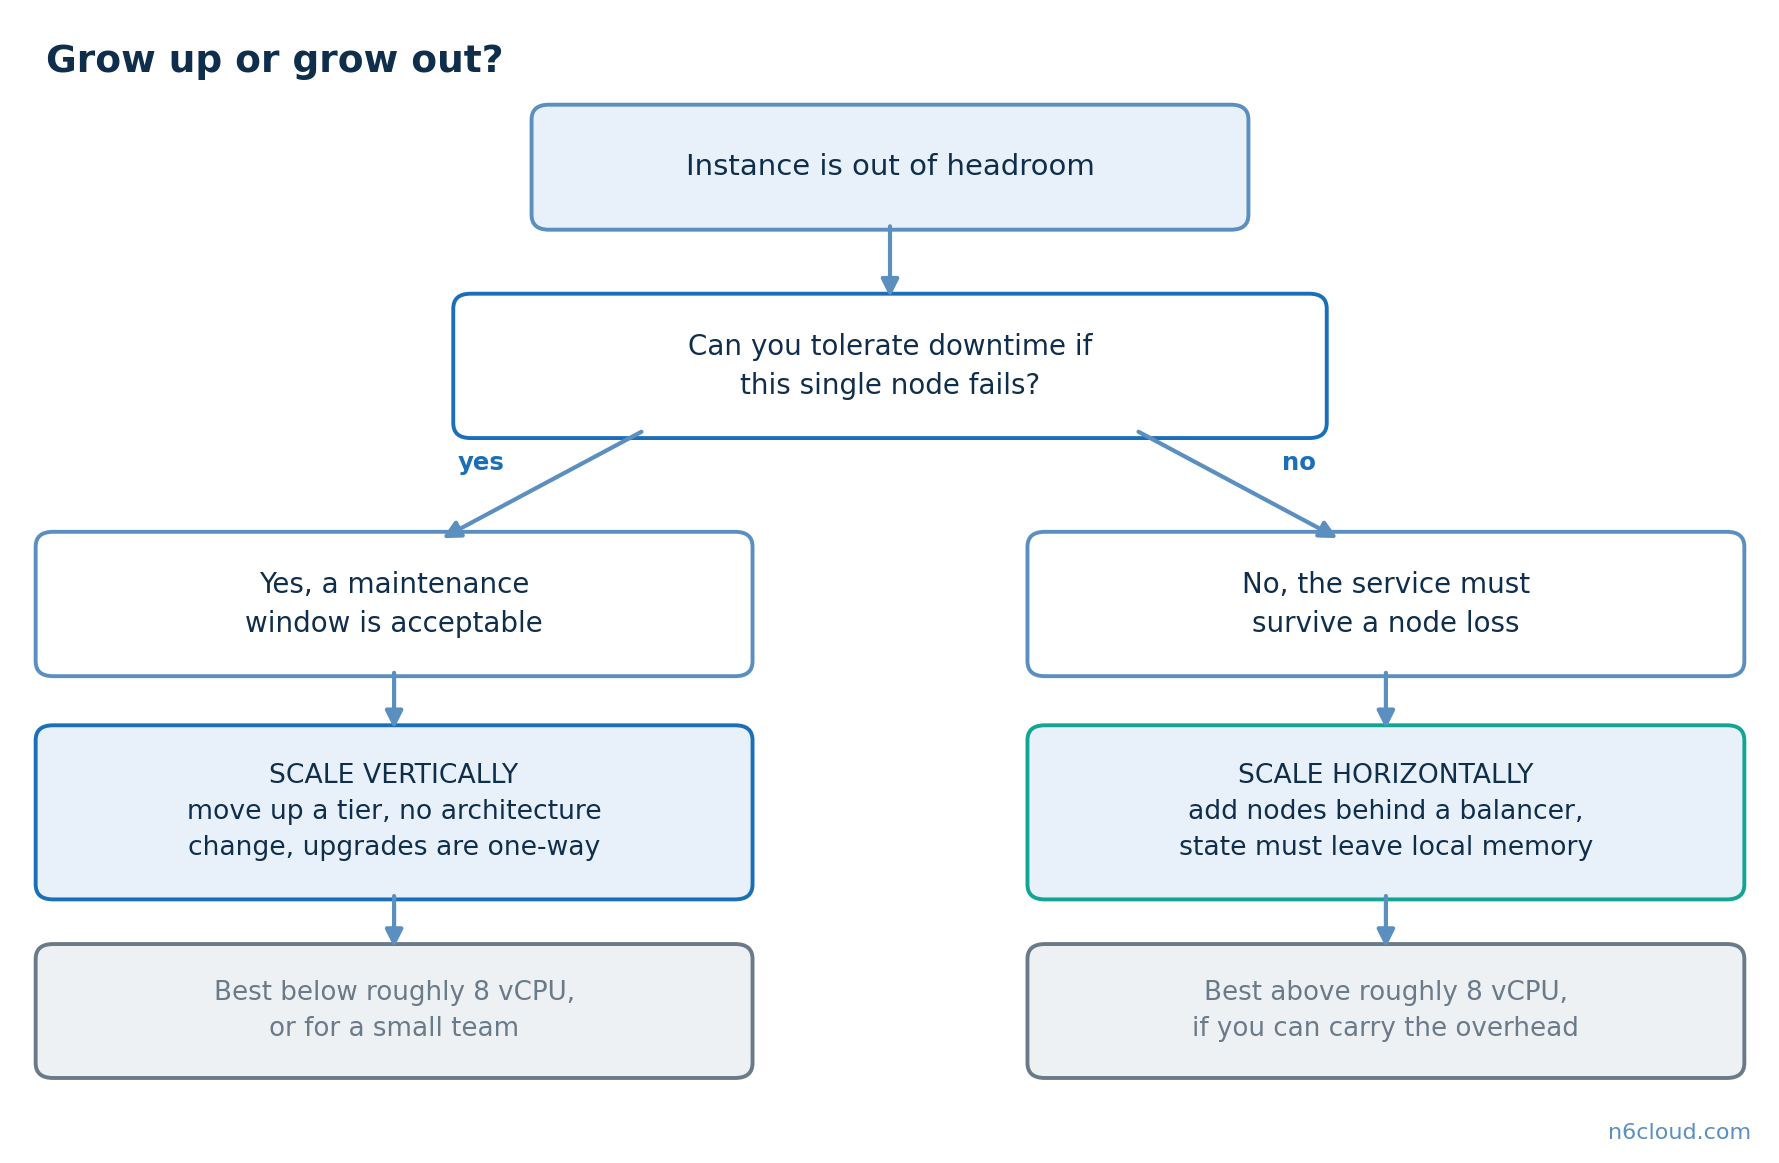 Figure 3: Choosing between vertical and horizontal scaling. The technical arithmetic favours horizontal at scale; the operational cost of statelessness decides whether that is the right answer for your team.
The Canadian Dimension: Latency and Data Residency

Physical distance is a specification too, and the one buyers most often ignore because it never appears on the product page. What matters is proximity rather than nationality. A user in Vancouver reaching a server in British Columbia typically sees a round trip of roughly 5 to 15 milliseconds, compared to closer to 55 to 80 milliseconds for US East or central Canada. Coast-to-coast traffic inside Canada is no faster than crossing the border, so read a hosting map by distance from your users rather than by the flag on the building. On one request that is imperceptible. On an application making six or eight sequential round trips per page, or a remote desktop session where every keystroke is a round trip, 50 milliseconds compounds into something users call sluggish without knowing why, which is why the RDP and trading workloads many N6 Cloud customers run are so sensitive to where the server sits.
The compliance picture deserves the same precision, because it is routinely overstated in hosting marketing. PIPEDA does not require that personal information about Canadians be stored in Canada. It requires accountability for safeguards, transparency regarding cross-border processing, and contractual protections when a foreign processor is involved, so domestic hosting is not, in itself, a federal obligation.
Where the obligation becomes real is one level down, and it is more particular than most hosting copy admits. Quebec’s Law 25 requires a documented privacy impact assessment before personal information is communicated outside the province, including to another Canadian province, so hosting in British Columbia does not exempt a Quebec enterprise from the assessment. Nova Scotia’s public-sector legislation imposes an outright residency requirement, and several health-sector regimes constrain out-of-province storage, while British Columbia relaxed its own in-Canada rule in 2021 in favour of an assessment-based approach. Beyond statute, many enterprise and government contracts specify Canadian residency regardless, and jurisdictional exposure is a separate matter, since data held abroad may be reachable by foreign legal process wherever the holding company is incorporated. N6 Cloud operates in British Columbia, which eliminates cross-border concerns and keeps the data under Canadian jurisdiction.
Conclusion
A specification sheet is the starting point for a conversation, not a description of what you will experience. A vCPU is an entitlement whose value depends on how the host is loaded, storage performance lives in the gap between “SSD” and NVMe, and bandwidth means two different things depending on who wrote the page. Each claim can be tested from within your own guest with tools already installed, and each should be, because the alternative is discovering the answer during your busiest week.
Profile the application, measure what you were given, and choose the tier that matches the constraint you actually have rather than the one that looks generous. When you are ready to apply that method, you can buy VPS hosting with NVMe storage in Canadian data centres, backed by a 30-day money-back guarantee if the measurements do not match the promise.