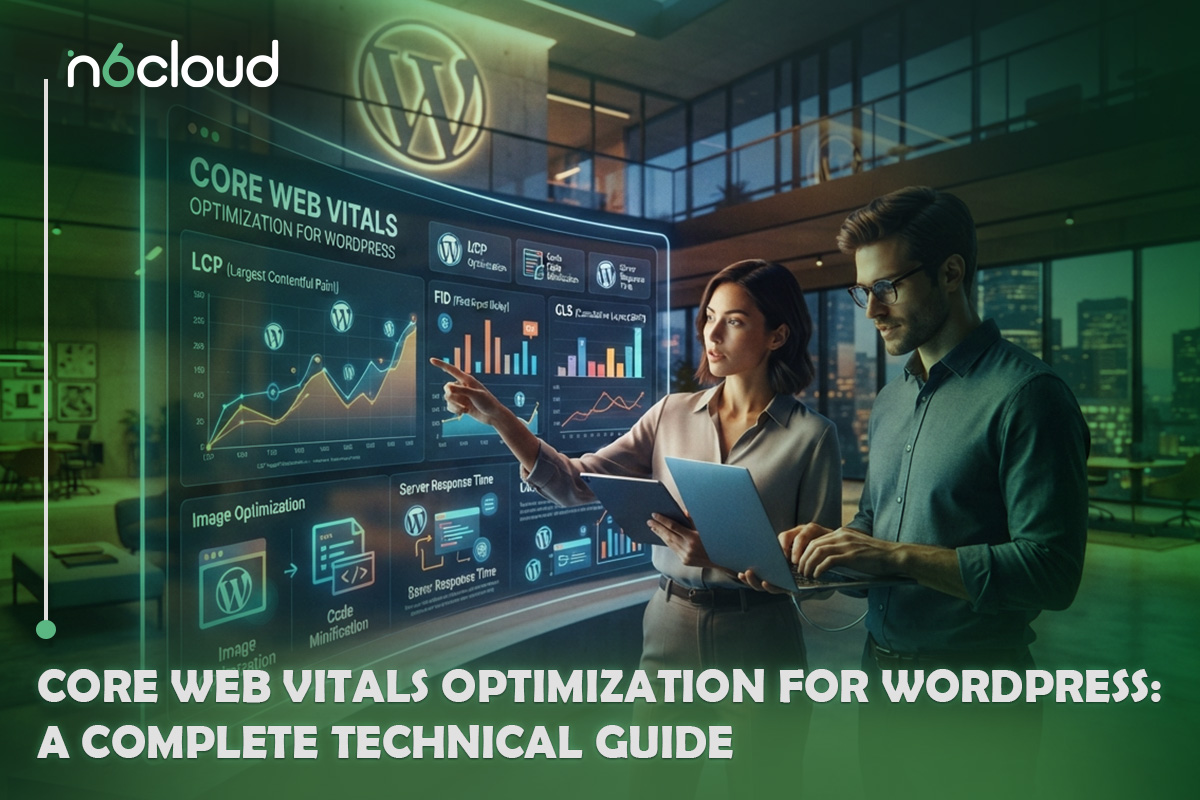
Across more than 2,795,000 WordPress origins measured on mobile in June 2026, 90.9 percent record a good Interaction to Next Paint and 87.2 percent record a good Cumulative Layout Shift, both above the average for the web as a whole. Only 24.2 percent record a good Time to First Byte, against a baseline of 45.6 percent. Compare that with March 2024, and the picture sharpens: WordPress gained 13.4 percentage points on INP over those 27 months and exactly zero on TTFB.
The ecosystem spent three years fixing the browser and left the server almost untouched. That is the argument this guide is built around, and the treatment is diagnostic rather than definitional. By the end, you should be able to break your own Largest Contentful Paint into its four component parts, name the script behind a slow interaction from field data, and decide what is worth fixing on your stack.
 Understanding Core Web Vitals in WordPress
What Core Web Vitals measure in 2026
Three metrics make up Core Web Vitals, and a page passes only when all three clear the good threshold at the 75th percentile of real page loads, measured separately for mobile and desktop. If a guide still discusses First Input Delay, it is out of date: INP replaced FID as a Core Web Vitals on 12 March 2024, and FID support ended across Google tooling on 9 September 2024. Chrome UX Report release notes covering all of 2025 and the first half of 2026 record no addition to the metric set and no threshold adjustment, despite a steady supply of blog posts announcing otherwise.
The distinction between field and lab data matters more than most people treat it. Field data comes from the Chrome UX Report, a 28-day rolling average collected from real Chrome users, while lab data comes from Lighthouse, one simulated load on one machine. Search Console reads the field data and groups URLs into buckets that share a similar experience, so a page can inherit a status set by pages you never tested. Time to First Byte and First Contentful Paint appear throughout this guide without being Core Web Vitals; both are diagnostic, and you optimize them because they sit inside LCP.
What Google actually says about ranking
Precision matters here, because most of what circulates on this point is invented. Google’s documentation, updated 10 December 2025, states that Core Web Vitals are used by its ranking systems, and states in the same breath that there is no single signal and that core ranking systems weigh a variety of factors aligned with overall page experience. No weighting has ever been published, so anybody quoting a percentage ranking uplift is quoting a number that exists in no Google source. Treat Core Web Vitals as a threshold to clear rather than a dial to turn, whose commercial value shows up in engagement and conversion long before it shows up in position.
Why WordPress sites struggle, and where they do not
The headline comparison is unflattering. On mobile, 48.8 percent of WordPress origins pass Core Web Vitals, against 85.5 percent for Duda, 80.1 percent for Wix and 76.5 percent for Shopify. The instinctive explanation is bloat, and the instinctive explanation is wrong.
Look at the per-metric breakdown, and WordPress sits above the web-wide baseline on two of the three Core Web Vitals. Its deficit is concentrated in LCP, at 55.7 percent against 65.6 percent, and it collapses on TTFB. The payload data points the same way: the median WordPress page on mobile ships 638 KB of JavaScript against 1,634 KB for Wix, and a lighter total page weight than Squarespace. WordPress sends roughly 40 percent of Wix’s JavaScript and loses to it by more than 30 percentage points, so weight is not the mechanism.
Builders and themes deserve measurement rather than blame. On mobile, GeneratePress origins pass at 52.6 percent, slightly ahead of the 48.8 percent WordPress average, while Divi sits at 42.7 percent, Astra at 40.6 percent, WooCommerce at 39.6 percent, and Elementor at 36.8 percent, all behind it. In every case, the deficit sits in LCP and TTFB rather than INP or CLS, and the lightest of the set is the only one above the platform mean.
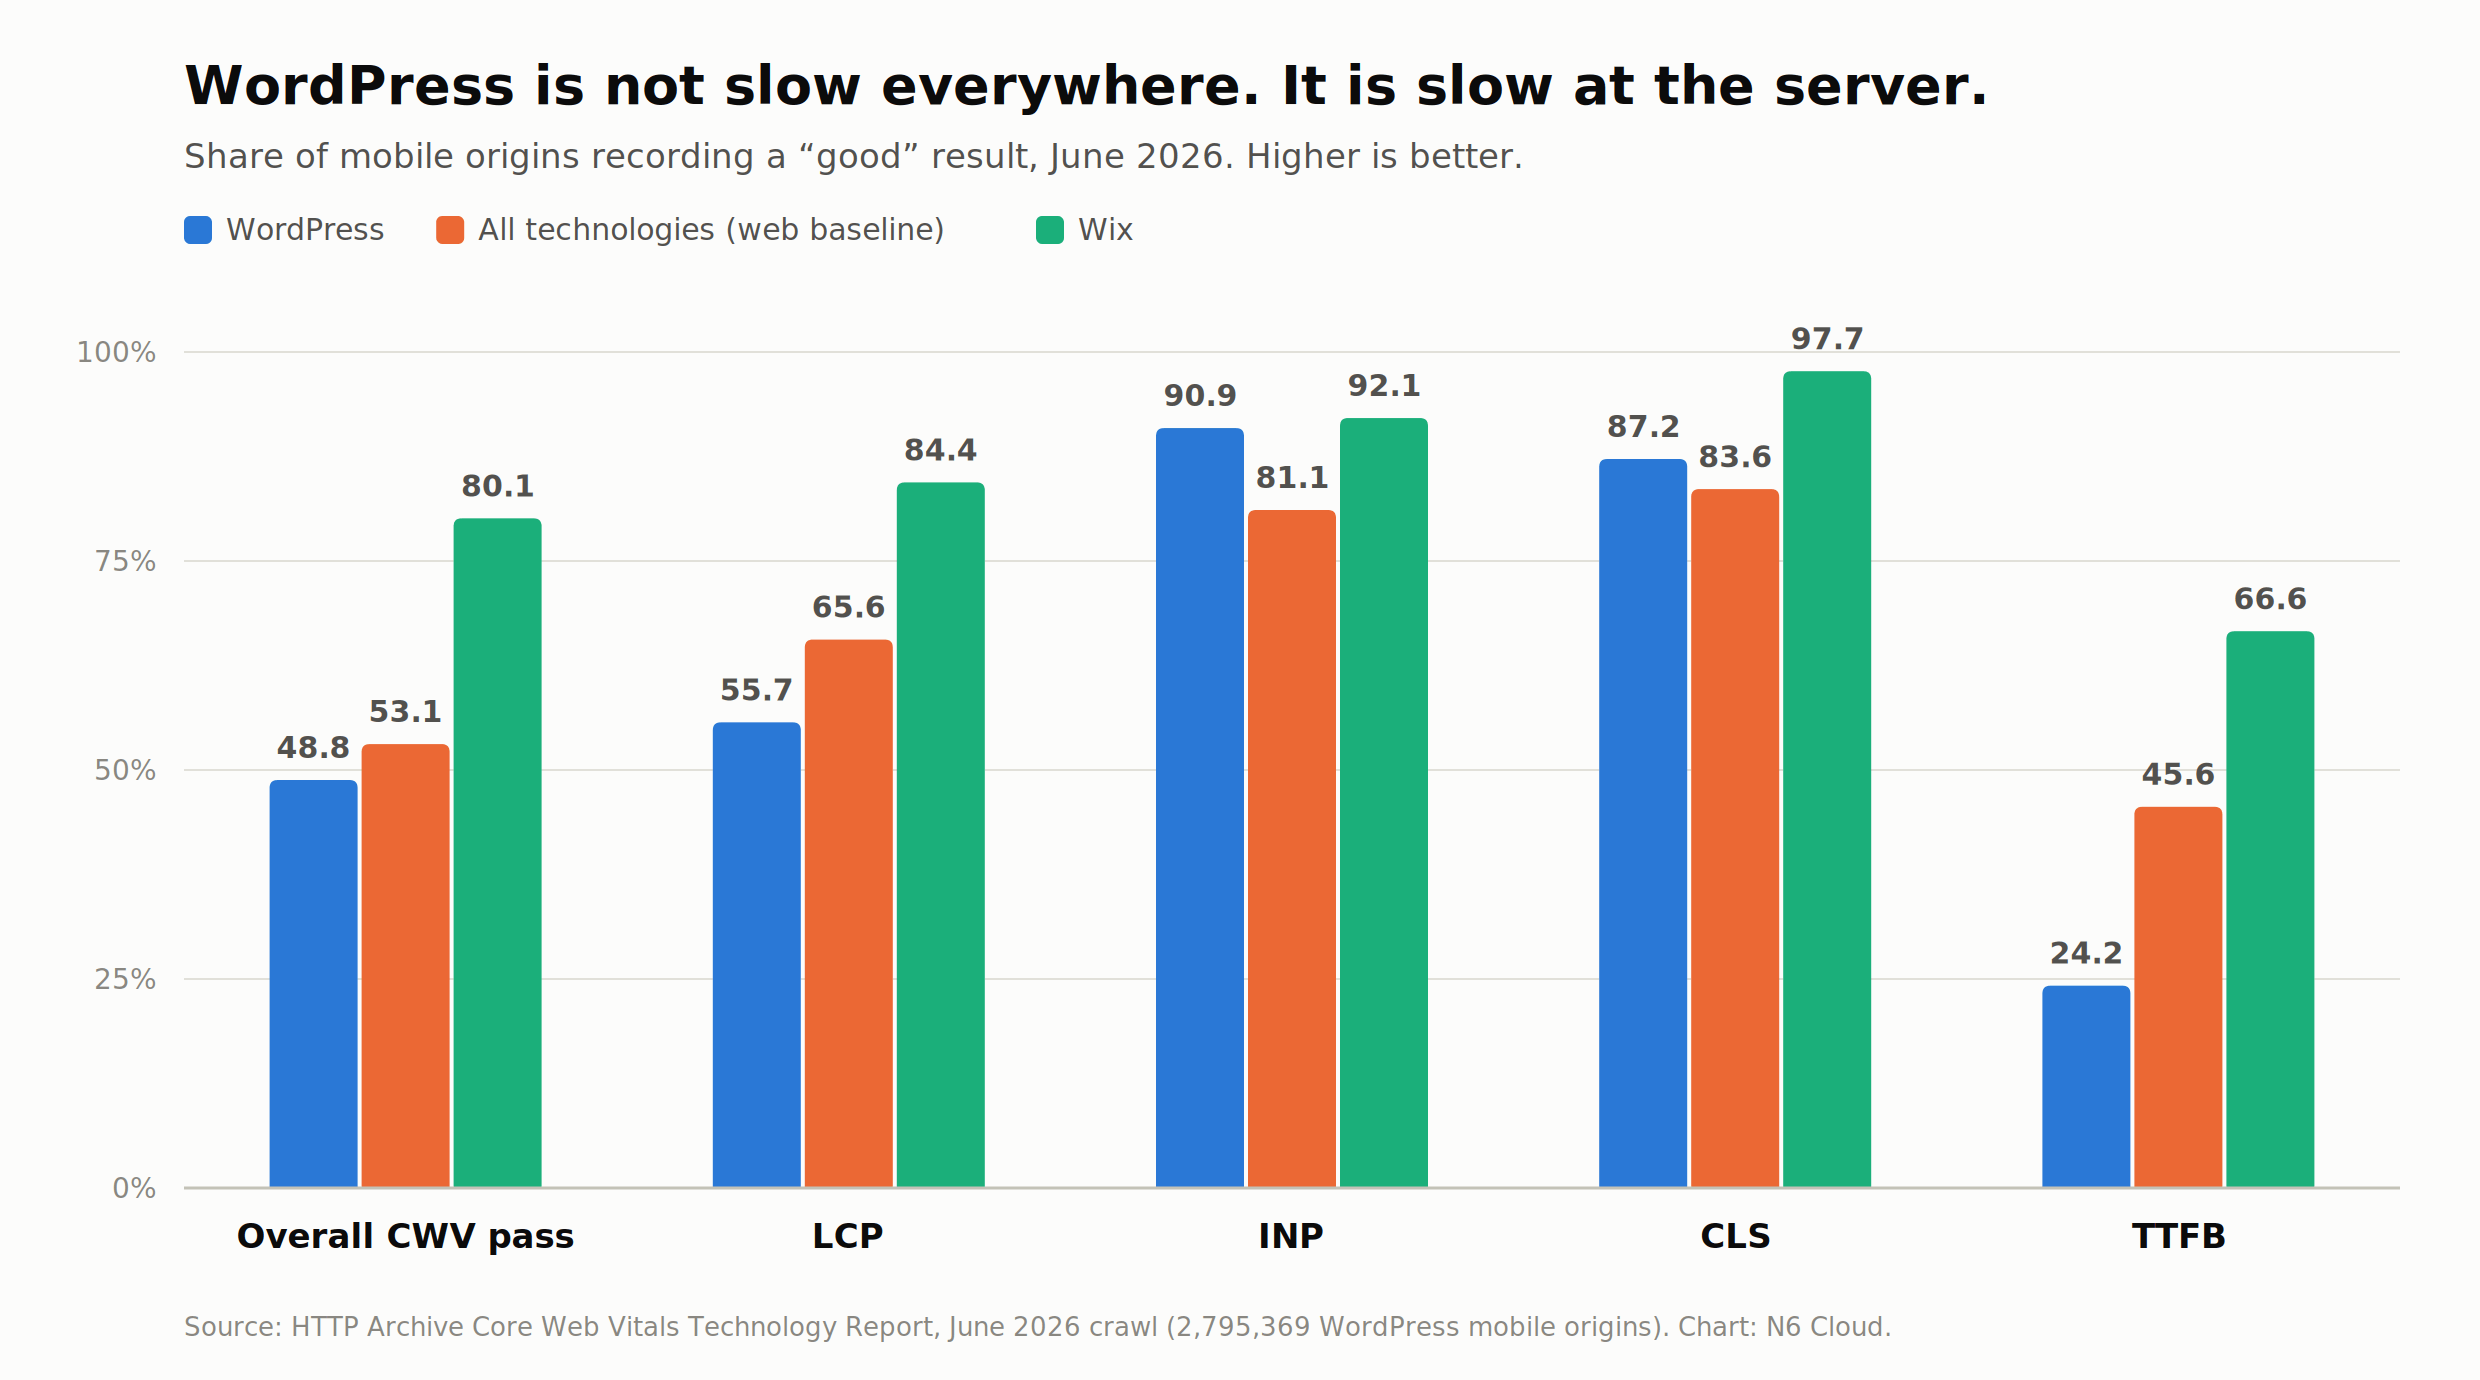
Figure 1. WordPress beats the web-wide baseline on INP and CLS and falls far behind on TTFB. Source: HTTP Archive Core Web Vitals Technology Report, June 2026.
Diagnosing Core Web Vitals issues in WordPress
Isolating LCP with the subpart framework
Most LCP advice is a list of tips applied in hope. Google publishes something better: a breakdown of LCP into four consecutive parts with target proportions, being TTFB at roughly 40 percent, resource load delay under 10 percent, resource load duration at roughly 40 percent, and element render delay under 10 percent.
Pull your own split from Chrome DevTools or the CrUX API, and it will fall into one of three patterns. A dominant TTFB share is a hosting and caching problem that no amount of image work will touch. A large load delay means the browser could not discover the LCP resource early, which on WordPress usually means a CSS background hero the preload scanner cannot see until the stylesheet is parsed. A large render delay means render-blocking CSS is holding up the paint, which is widespread: only 15 percent of mobile pages pass the Lighthouse render-blocking resources audit.
Isolating INP
INP breaks into three components, and the correct fix differs for each. Input delay is the time before your handler runs at all, caused by the main thread already being occupied, so the answer is fewer and shorter tasks. Processing duration is the handler doing its work, so the answer is to yield the thread. Presentation delay is the gap between the handler finishing and the next frame painting, and the answer lies in DOM size and style recalculation.
Finding the culprit on a production site with forty plugins is not something you do by reading source code. The practical method is the web-vitals JavaScript library in its attribution build, which since version 4 includes Long Animation Frame data and names the script behind a slow interaction in real sessions. No dataset attributes WordPress INP to particular components, but the pattern practitioners report is main-thread contention from third-party advertising and chat scripts, mobile menus, popups, sliders and oversized DOM trees.
Isolating CLS
CLS is widely misunderstood as a running total of every shift on the page. It is the largest burst of shifts within a session window, where shifts within one second of each other are grouped, and the window is capped at five seconds, so fixing one late-loading element often moves the metric substantially. The causes are images and iframes without dimensions, which affect 62 percent of mobile pages; web fonts rendering at a different size to the fallback; ads and embeds that resize after arriving; and DOM injected above existing content. All are easy to miss locally, where cached assets and a fast connection hide the shift.
TTFB and the hosting ceiling
Here is the central argument in one paragraph. Only 24.2 percent of WordPress origins record a good TTFB on mobile, against 45.6 percent for the web as a whole, and that number is identical to March 2024 while every browser-side metric improved by six to thirteen points. TTFB is not a Core Web Vitals metric, but it should account for roughly 40 percent of your LCP budget, so a 900 millisecond server response consumes more than a third of the 2.5 second allowance before the browser has requested a byte of content.
Four things set it, in descending order of leverage: full-page cache hit ratio, object and database caching, PHP execution, and network distance. Underneath all four sits how much CPU, memory and I/O your account actually has, which on shared hosting varies with what your neighbours are doing. Resource contention is the one class of performance problem no plugin has solved, and sites that have exhausted the plugin layer usually end up moving to high-performance VPS hosting, where CPU and memory are allocated rather than shared.
 How to optimize Core Web Vitals in WordPress
LCP optimization techniques
Start with discovery, the cheapest win and the most commonly missed. Before changing anything, confirm what your LCP element actually is, because it is frequently not the element the designer has in mind. PageSpeed Insights names it in the diagnostics under the LCP audit, and the Chrome DevTools performance panel marks it on the timeline when you record a page load. Since version 6.3, core applies fetchpriority=”high” to the first image it believes is the LCP candidate, provided that image covers at least 50,000 pixels of area, and skips native lazy-loading for the first three images. That is a static heuristic with no visibility into sliders, galleries or background images, which is why sixteen to seventeen percent of pages still lazy-load their own LCP image.
Where the LCP element can be a real <img> tag, make it one and let core do the work. Where the design requires a CSS background hero, the preload scanner cannot see the file until the stylesheet has been downloaded and parsed, so you have to announce it yourself, with media queries so each breakpoint fetches only its own asset:
Do not invent those four numbers. They are derived from the real font’s metrics measured against the fallback’s, and the practical way to obtain them is a tool such as Capsize, or the fallback generators built into the JavaScript frameworks, which read the font file and output the values for you. That automation exists in neither WordPress core nor any major performance plugin, which is what makes this a real gap for anyone willing to write ten lines of CSS. Put the block in your theme’s stylesheet ahead of any rule that uses the family, and list the fallback after the real font in font-family so the browser reaches it only while the real one is still loading. Verify the result in the DevTools rendering panel with layout shift regions turned on, reloading with the cache disabled, because a cached font hides the exact shift you are trying to remove. Finally, reserve space for advertising slots, embeds and cookie banners before they arrive, since these produce the single large burst that usually sets the score.
TTFB optimization
Work in order of leverage. Server-side full-page caching comes first, because a cached response never invokes PHP or the database, which makes cache hit ratio the highest-leverage number on the site. Once caching is in place, the question becomes how expensive the requests that bypass it are, and that is where object caching enters.
WordPress uses a non-persistent object cache by default, so the same option, term and post meta queries re-run on every request, and Redis or Memcached converts those into memory lookups that persist between requests. The benefit scales with query count and with how much traffic cannot be cached, which is why object caching transforms WooCommerce stores and membership sites and does comparatively little for a brochure site served entirely from cache. No credible independent benchmark quantifies this in general terms, and any article quoting a precise percentage is quoting marketing. PHP deserves a similar correction: two 2025 benchmarks with disclosed methodology, from Kinsta and Tideways, both found the move from PHP 7.4 to 8.4 or 8.5 worth roughly five to seven percent on WordPress throughput, not the multiples that circulate in hosting marketing.
A CDN reduces distance to the visitor, although placing one in front of a slow origin does not fix an origin problem for uncached requests, and serving a mostly Canadian audience from a Canadian data centre removes a round trip no optimization recovers. When caching, object caching, PHP tuning and a CDN are all in place, and the response is still slow, the constraint is resources, and that is where purpose-built WordPress Hosting earns its keep. N6 Cloud’s WordPress hosting plans start at $2.24 per month with free Cloudflare CDN integration, HTTP/2 and HTTP/3, CloudLinux account isolation, daily backups, and Canadian data centres; the Lightning Premium and Lightning Ultimate tiers from $6.74 add LiteSpeed with LiteSpeed Cache for server-level full-page caching with proper invalidation.
 What the data says actually works
Measured results from WordPress core itself
The most credible before-and-after data available for WordPress performance work is published by the core performance team, because the methodology is disclosed and anyone can reproduce it. The WordPress 6.9 frontend work, benchmarked over 100 page loads per configuration, produced a 33.1 percent reduction in First Contentful Paint and an 18.9 percent reduction in LCP on the 2025 sample page, and removing all render-blocking stylesheets from that theme improved LCP by roughly 36 percent on Fast 4G and roughly 45 percent on Slow 3G.
The more instructive figure goes the other way. Raising the inline style limit from 20 KB to 40 KB improved uncached LCP-TTFB by 31.39 percent and worsened cached LCP-TTFB by 21.44 percent, so inlining trades repeat-visit efficiency for first-visit render speed and is a decision rather than a best practice. These are controlled lab benchmarks on emulated connections, not field data, and should be read as direction rather than a promise about your site.
A realistic optimization sequence
Order the work by leverage rather than ease. Begin with server-side full-page caching and verify the hit ratio, then identify your true LCP element per breakpoint and make it discoverable, eliminate render-blocking CSS, set image dimensions and convert to modern formats, dequeue scripts conditionally, add object caching if a meaningful share of traffic bypasses the page cache, add a CDN, and resolve font handling. Change one thing at a time, then wait, because the Search Console report uses a 28-day rolling window and anybody expecting same-week confirmation will misread their results and revert changes that were working.
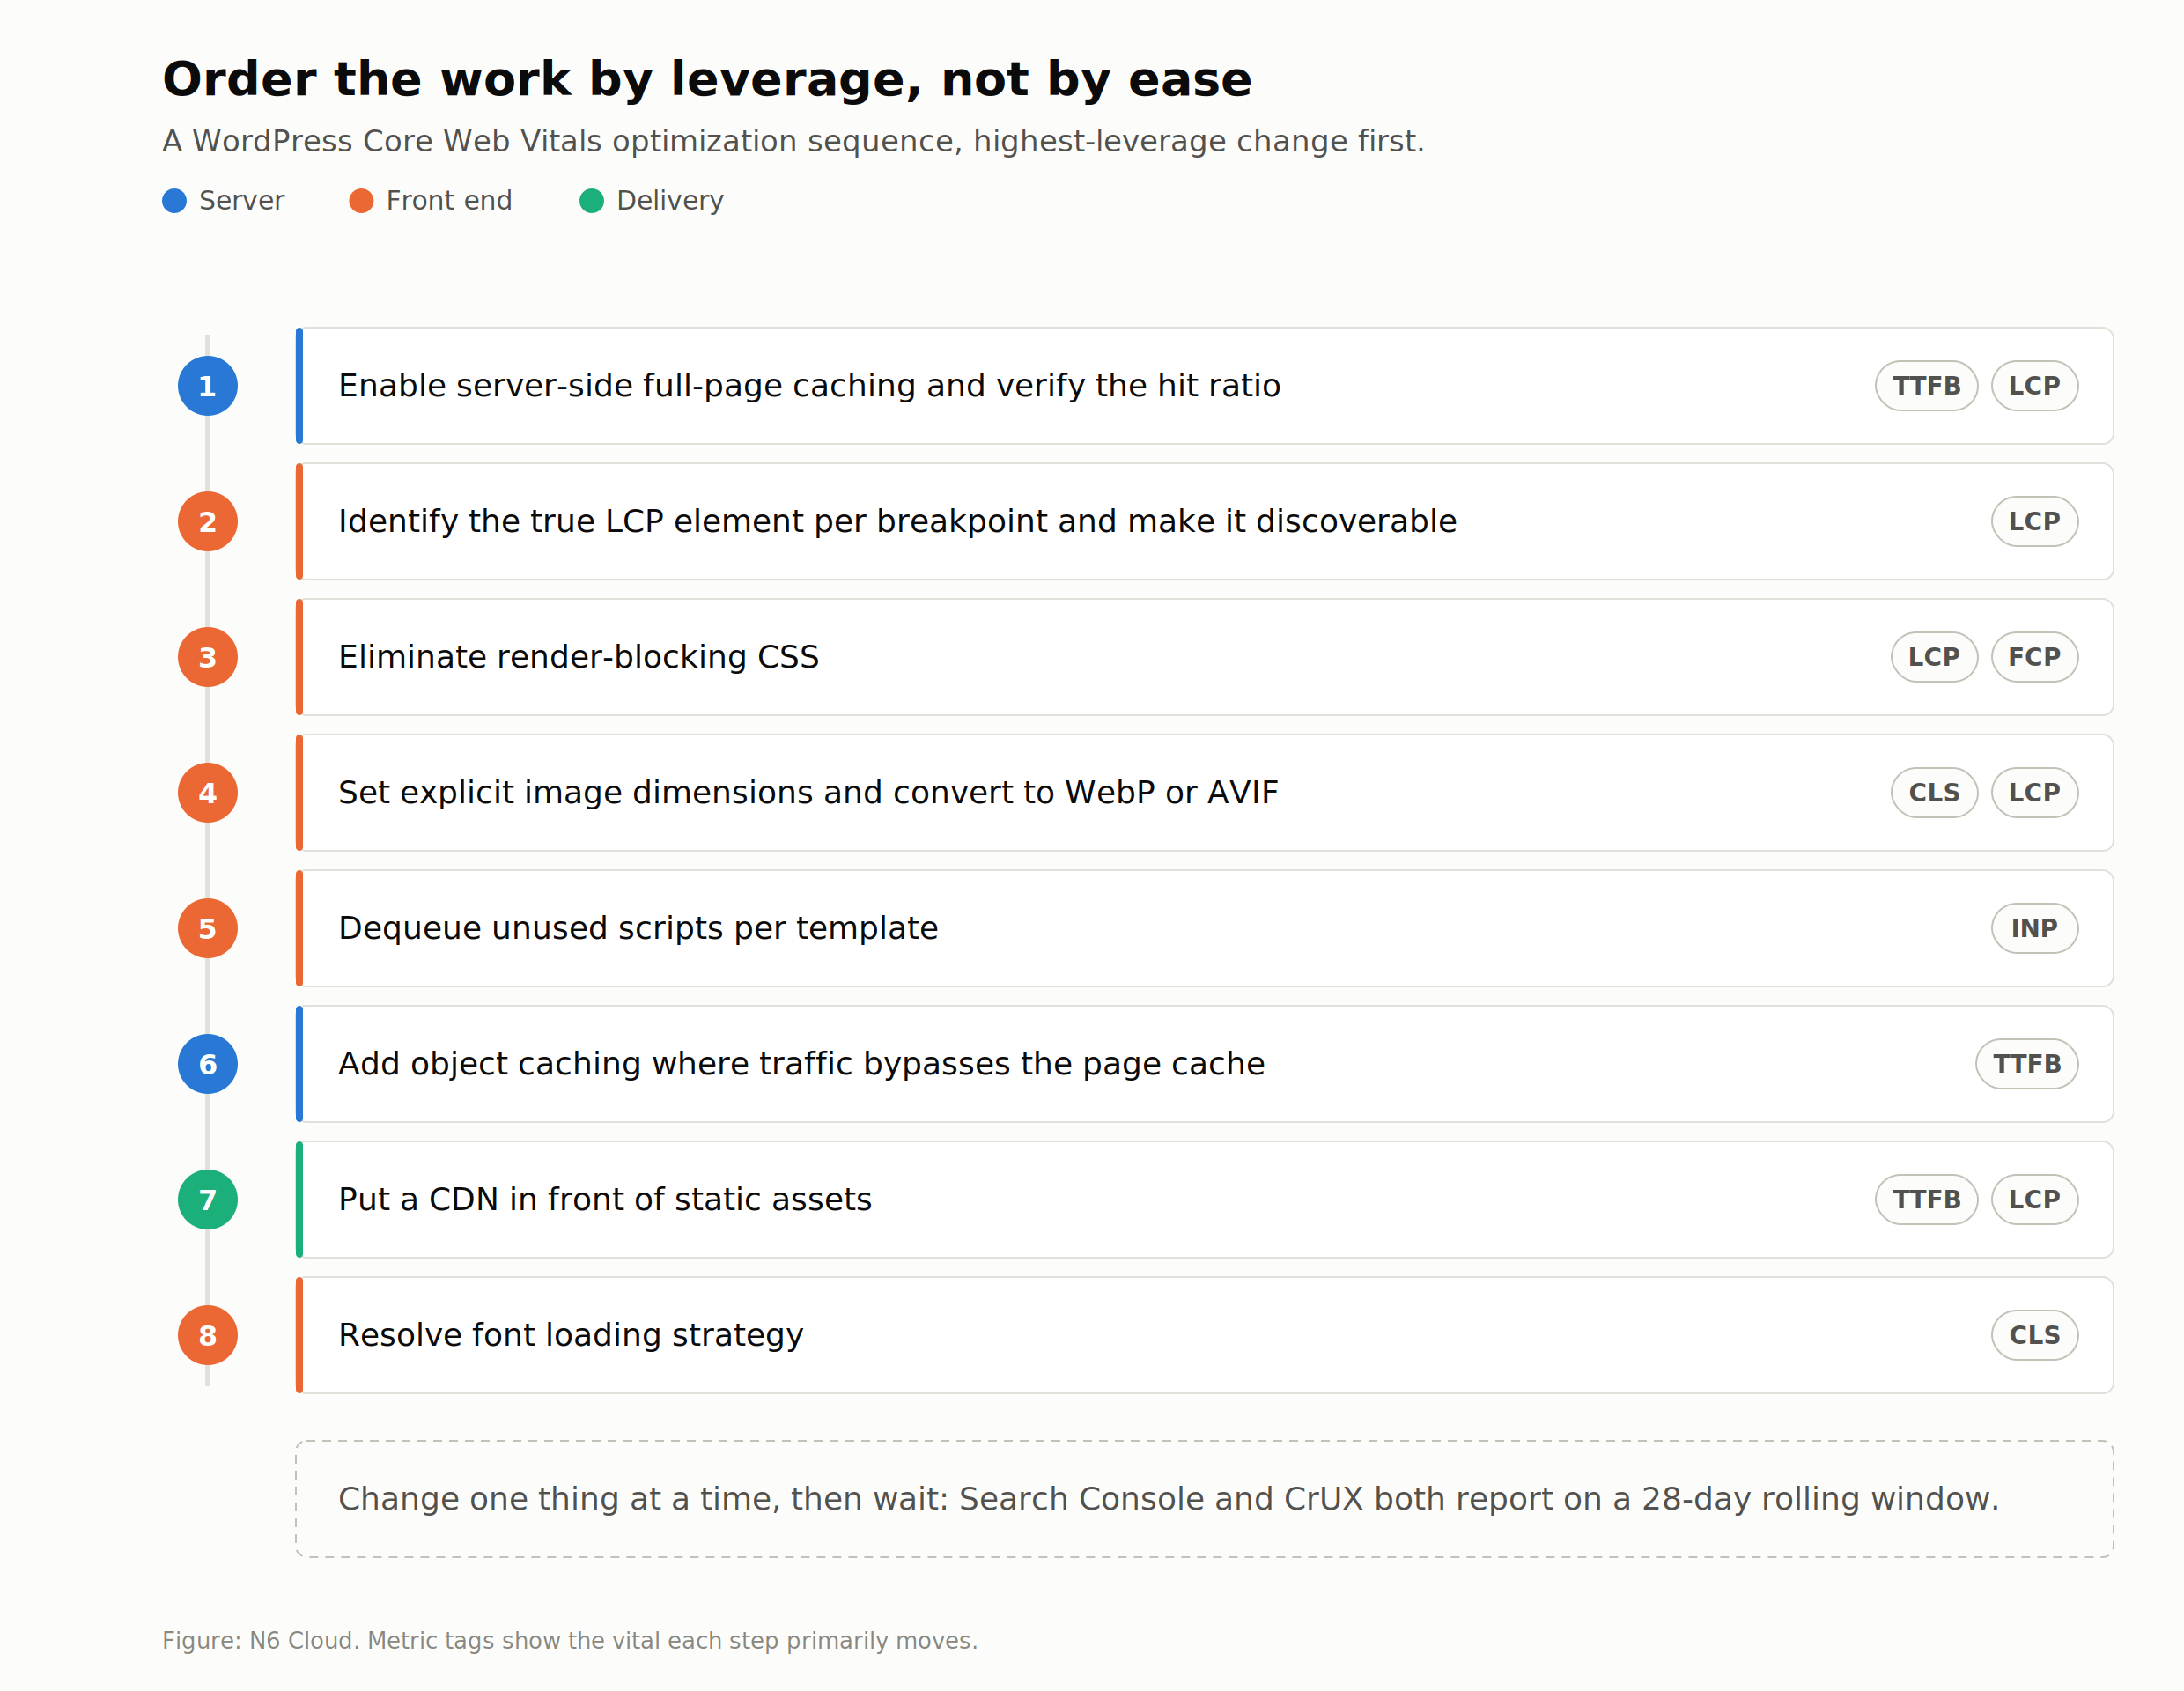 Figure 2. The optimization sequence, ordered by leverage rather than ease, with the vital each step primarily moves.
Tools, plugins and monitoring
Performance plugins, described by what they do
LiteSpeed Cache is the largest by installed base at more than seven million sites, and it carries a constraint frequently omitted from recommendations: server-level page caching requires a LiteSpeed or OpenLiteSpeed server, or QUIC.cloud, while its other features work on any stack. WP Rocket is the common choice on conventional Apache or NGINX hosting, covering page caching, preloading and asset optimization in one commercial package. Perfmatters is worth knowing for its Script Manager, which dequeues scripts per post and per page through the interface rather than in code, and Autoptimize remains the most credible free option outside the caching layer.
The official Performance Lab plugin is now a loader for standalone feature plugins, of which Optimization Detective and Image Prioritizer are the interesting pair, collecting real user metrics across breakpoints and applying the correct priority and preload hints for the LCP element visitors actually experience. One thing to state clearly: no independent comparison of these plugins with a disclosed methodology exists, and nearly all “best caching plugin” content is affiliate-monetized.
Testing and monitoring
Use PageSpeed Insights first, because it shows field and lab data side by side and the gap between them is itself diagnostic. Lighthouse is a simulated single load and should be read as a directional check rather than a measure of user experience, while the Chrome DevTools performance panel is where you find the specific long task behind a poor INP.
For field monitoring, the Search Console Core Web Vitals report is the baseline, with its 28-day window understood, and the CrUX History API gives weekly series that catch a regression faster than the monthly dataset. For real user monitoring, the web-vitals library, currently at version 5.3.0, is the standard, and its attribution built with Long Animation Frame data is the only practical way to name the script behind a slow interaction on a live WordPress installation.
Conclusion
The browser-side work across the WordPress ecosystem is largely done. INP and CLS are now platform strengths, sitting above the web-wide average, and core ships meaningful improvements in each release. The metric that has not moved in more than two years is the one your host controls, and it consumes the largest single share of your LCP budget before any front-end work gets a chance to matter. Before you touch another image, pull your own LCP subpart split and see how much of the 2.5 second budget the server is eating. If TTFB is taking well beyond forty percent of it, you have found your constraint, and it is not in your theme.