

Shared Hosting Resource Limits: What Each One Does and How Much Traffic Fits

Table of Contents

A local news site mentions your bakery’s new menu, and hundreds of people tap the same link within a minute. Some see a page that says “508 Resource Limit Is Reached”, while your plan still promises unlimited bandwidth. What ran out was a per-second ceiling. Once you understand each shared hosting resource limit, you can estimate how much traffic your plan can handle.

What Are Shared Hosting Resource Limits (and Why “Unlimited” Still Has a Ceiling)?

Shared hosting resource limits are per-account ceilings on processor time, memory, disk activity, simultaneous requests, and file count, so one site can’t take more than its share. On shared hosting, many sites draw on one machine’s cores, memory, and disks. Without ceilings, one busy site could slow the rest.

A shared commercial kitchen works the same way. Several small food businesses rent stations, each with its own burners, counter space, and a fixed number of order tickets on the rail. The dishwasher is shared, so a busy neighbour can’t take your burners but can still fill the dishwasher when you need clean pans.

On many shared servers, CloudLinux sets up those stations by putting each account in a Lightweight Virtual Environment (LVE), a fence built into the operating system. The CloudLinux LVE documentation describes the limits as ceilings: each account gets a fair share and can’t go over its limits. A second layer, CageFS, keeps each account’s files private from the other accounts on the server.

The “unlimited” on a plan page measures something else. It usually covers totals, such as monthly bandwidth (the data your server sends to visitors) and storage space. Limits that affect page load times are counted per second, and a small site rarely runs out of bandwidth before it runs out of the processing they ration.

What Each Limit Does When You Hit It: CPU, Memory, I/O, Entry Processes, and Inodes

Each limit fails differently: some slow the site, some return an error page, and one stops new files being saved. Table 1 lists CloudLinux’s published values for a typical and a high-end account. If you’re chasing an error, read the last column; the sections below explain each row.

Limit (CloudLinux code) What it caps CloudLinux typical/high-end account What happens at the limit What a visitor sees
CPU (SPEED)
Processor time, as a share of one core
100% / 200% (one core / two cores)
Processes wait for processor time
Slower pages
Disk throughput (IO)
Data read from and written to disk each second
1,024 / 4,096 KB/s
Processes are briefly put to sleep
Slower pages
Disk operations (IOPS)
Separate read and write operations each second
1,024 / 1,024
Operations pause until the second ends
Slower pages
Memory (PMEM)
Memory used by all the account’s processes together
1 GB / 2 GB
Disk cache is freed, then processes are stopped
A 500 or 503 error page
Processes (NPROC)
Processes running in the account at once
100 / 150
No new process can start
Possibly a 500 or 503 error page
Entry processes (EP)
Requests running PHP inside the account at once
20 / 40
New requests are turned away
“508 Resource Limit Is Reached”
Inodes
Files and folders in the account
No CloudLinux default; commonly 200,000 to 250,000 on entry plans
Nothing new can be saved (hard limit)
Failed uploads, updates, and incoming mail

Table 1. Values from CloudLinux’s documentation (default and recommended “Typical” and “High End” account profiles), checked on 26 October 2026. The inode range comes from one review site’s sample of the cheapest plans at 13 hosts. Each host sets its own values.

CPU and Disk I/O Limits: The Ones That Slow You Down

At its CPU or I/O ceiling, an account’s processes are made to wait, not stopped, so the site slows but stays online. Visitors wait along with them. CPU (SPEED) is a share of one core, so 100% is one core and 200% is two. The estimate later in this article uses CPU seconds per request: the processor time it takes to build one page. It’s usually shorter than the visitor’s wait, which includes time spent on the database or network. A page that takes 1.5 seconds might use a quarter of a second of CPU.

Disk limits come in two kinds, neither about space: I/O caps data read and written each second, and IOPS caps separate operations. At the I/O limit, processes are put to sleep for a moment; at the IOPS limit, they pause until the second ends. Reads served from memory don’t count, so page views rarely hit these limits; backups, imports, and plugin updates are the usual cause.

Memory and Process Limits: The Ones That Return 500 and 503 Errors

Physical memory and process limits cap everything running in your account at once, and going over them gets processes stopped or refused. Physical memory (PMEM) covers all the account’s processes, while PHP’s memory_limit caps one script. Many scripts at once can reach the total even when each stays under its own limit.

With 1 GB and a common memory_limit of 128 MB, eight scripts at their maximum fill the account (an illustrative case). CloudLinux then frees memory used for disk cache and, if that isn’t enough, stops some processes. Their requests fail, and visitors get a 500 or 503 page instead of the content.

The process limit (NPROC) counts every process in the account, including ones PHP and cron jobs start. At the limit, no new processes can start, and the web server may return a 500 or 503. CloudLinux advises setting it above the entry-process limit plus 15, so traffic never reaches it first.

Entry Processes: The Limit Behind Error 508 (and How It Differs From PHP Workers)

An entry process is a request entering your account to run PHP, the language WordPress is written in, and the entry-process limit caps how many can run at once. CloudLinux’s default is 20. When every slot is busy, the next request gets error 508, and the visitor sees a short page titled “508 Resource Limit Is Reached”.

A request keeps its slot until its page is finished, so a 1.5-second page holds it 10 times longer than a 0.15-second one. Just 20 slow requests arriving together can fill the limit on a quiet site. Much of that time goes to waiting on a slow database query, a heavy plugin, or a payment gateway, which uses no processor time. That’s why a 508 can appear with entry-process faults and no CPU faults beside them.
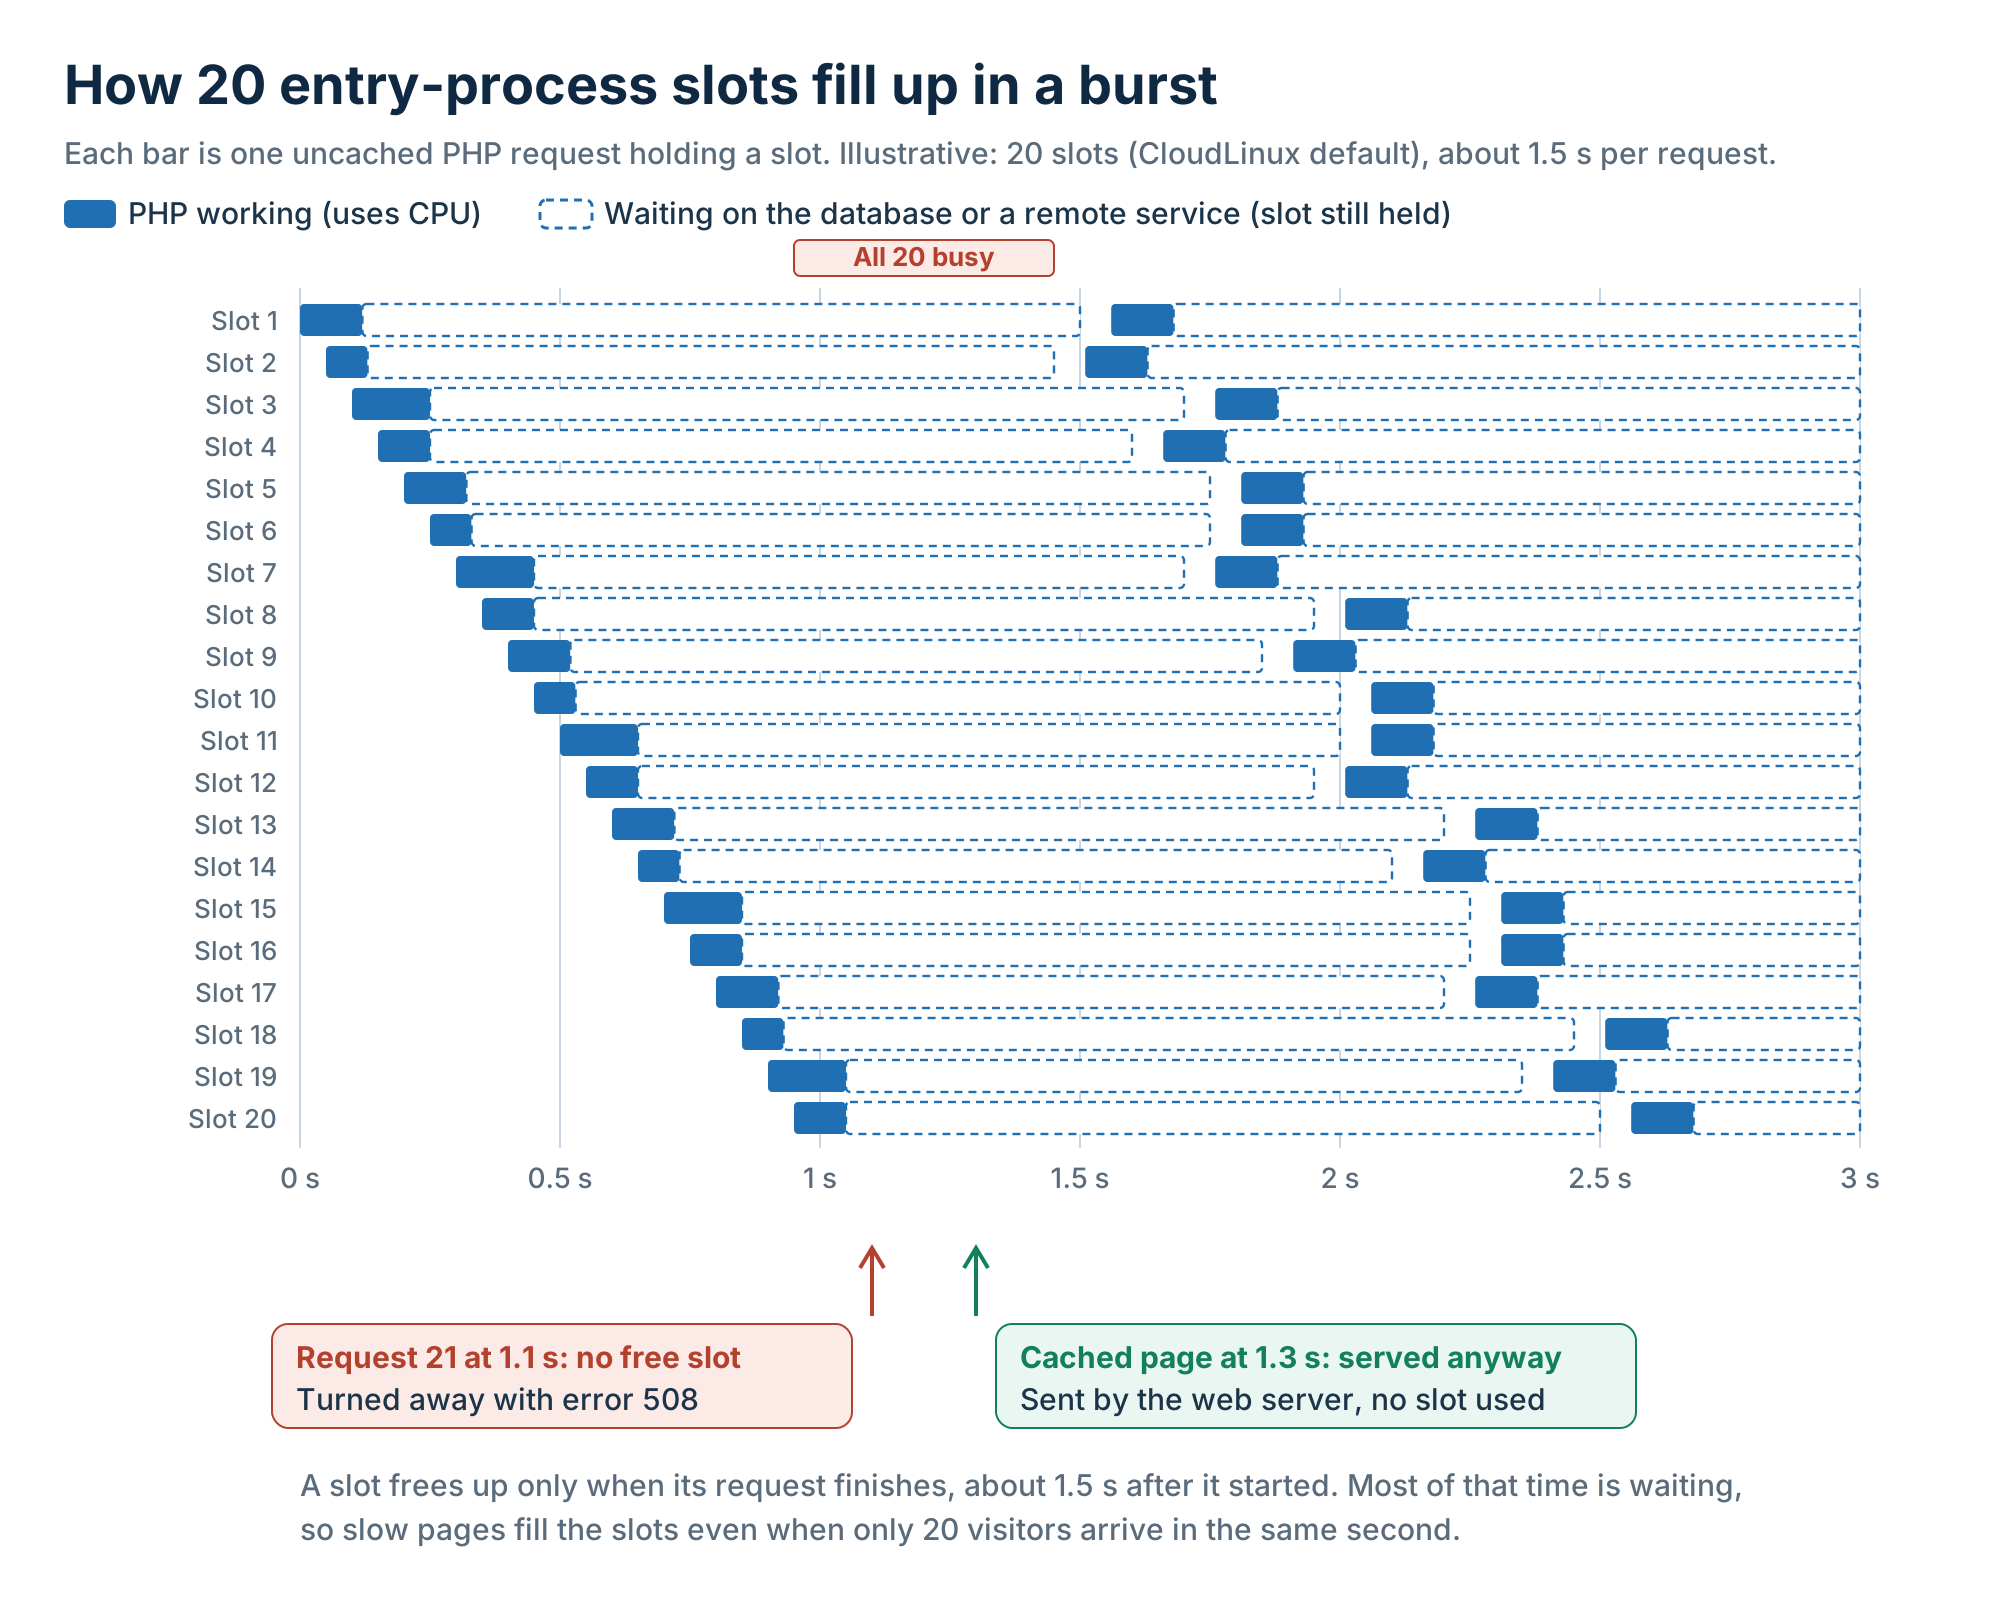
Timeline of 20 entry-process slots filling with slow PHP requests, a 21st request turned away with error 508, and a cached page served without a slot. Figure 1. Slow requests hold their slots mostly while waiting, so 20 of them arriving within a second fill the limit and the next request gets a 508.

If you’re comparing hosts, “PHP workers” (a managed WordPress term for PHP processes that can run at once) map to entry processes differently by web server. On Apache with CloudLinux (CGI or mod_lsapi), each running PHP request is one entry process. On LiteSpeed, a setting called PHP suEXEC Max Conn also caps PHP processes for each account, as LiteSpeed’s PHP documentation explains, and the lower of the two numbers applies. With nginx and PHP-FPM, CloudLinux doesn’t enforce the limit, and the PHP-FPM pool size sets the cap instead.

Inode Limits: Why File Count Matters

An inode is the record a server keeps for one file or folder, so an account can run out of inodes with plenty of disk space left, and then nothing new can be saved. A 2 KB cache file uses one inode, the same as a 200 MB video. Page-cache files, PHP session files, and stored email add up quickly. So do images: WordPress hosting sites save each upload as the original plus up to six resized copies (one more for photos larger than 2,560 pixels), and themes can add more. A library of 10,000 large images can use about 70,000 inodes on its own. On an entry plan with 200,000 inodes, that’s more than a third of the allowance before any cache files or email.

Hosts set the inode limit as hard or soft. A hard limit stops new writes at once, while a soft limit allows a grace period, seven days by CloudLinux’s default, before writes stop. After that, uploads fail, updates stop partway, and incoming mail can’t be stored.

How Much Traffic Can Shared Hosting Actually Handle? A 3-Step Estimate

A typical shared account can build only a handful of uncached pages a second, but it can serve many times that from cache. Monthly totals rarely matter: one request every second for a 30-day month is already about 2.6 million requests. What counts is how many uncached requests arrive in the same few seconds, and these three steps work that out with labelled examples.

Step 1: Work Out Your Two Ceilings for Uncached Requests

Your ceiling for pages PHP has to build is the lower of two numbers: entry processes divided by server time per request, and cores divided by CPU time per request. The first comes from Little’s law, a basic rule of queues: jobs in progress equal arrivals a second times the time each job takes. The second applies the same idea to the processor.

In N6 Cloud’s test, an uncached cart page on a shared plan had a median time to first byte of 1.02 seconds (0.96 to 2.14 over 10 runs). That’s the wait before the page starts reaching the browser. A cached page took 0.31 seconds, so the server spent about 0.71 seconds building the cart. The WooCommerce store ran on PHP 8.3, tested one request at a time from one location. Requests passed through a relay server (a proxy), and subtracting the cached time removes most of that network and proxy delay. It’s one site, so treat the result as an estimate.

A cart is a heavy WordPress page, and the store had no object cache (a memory store, such as Redis, for database results). For public pages on WordPress sites without one, DebugHawk’s report on 5.7 million page views in late 2025 found a median PHP time of about 1.5 seconds. This cart was built well inside that normal range. With CloudLinux’s default of 20 entry processes, the ceiling is 20 ÷ 0.71 ≈ 28 uncached requests a second.

CPU time wasn’t measured, so take an illustrative 0.25 CPU seconds a page. One core then builds at most 1 ÷ 0.25 = 4 pages a second, and an account with CloudLinux’s default of one core tops out at 4, not 28. The worksheet after Step 3 shows how to find your own numbers. The estimate assumes requests arrive evenly with no backups running, so treat it as an upper bound. Figure 2 shows other CPU times and core counts.
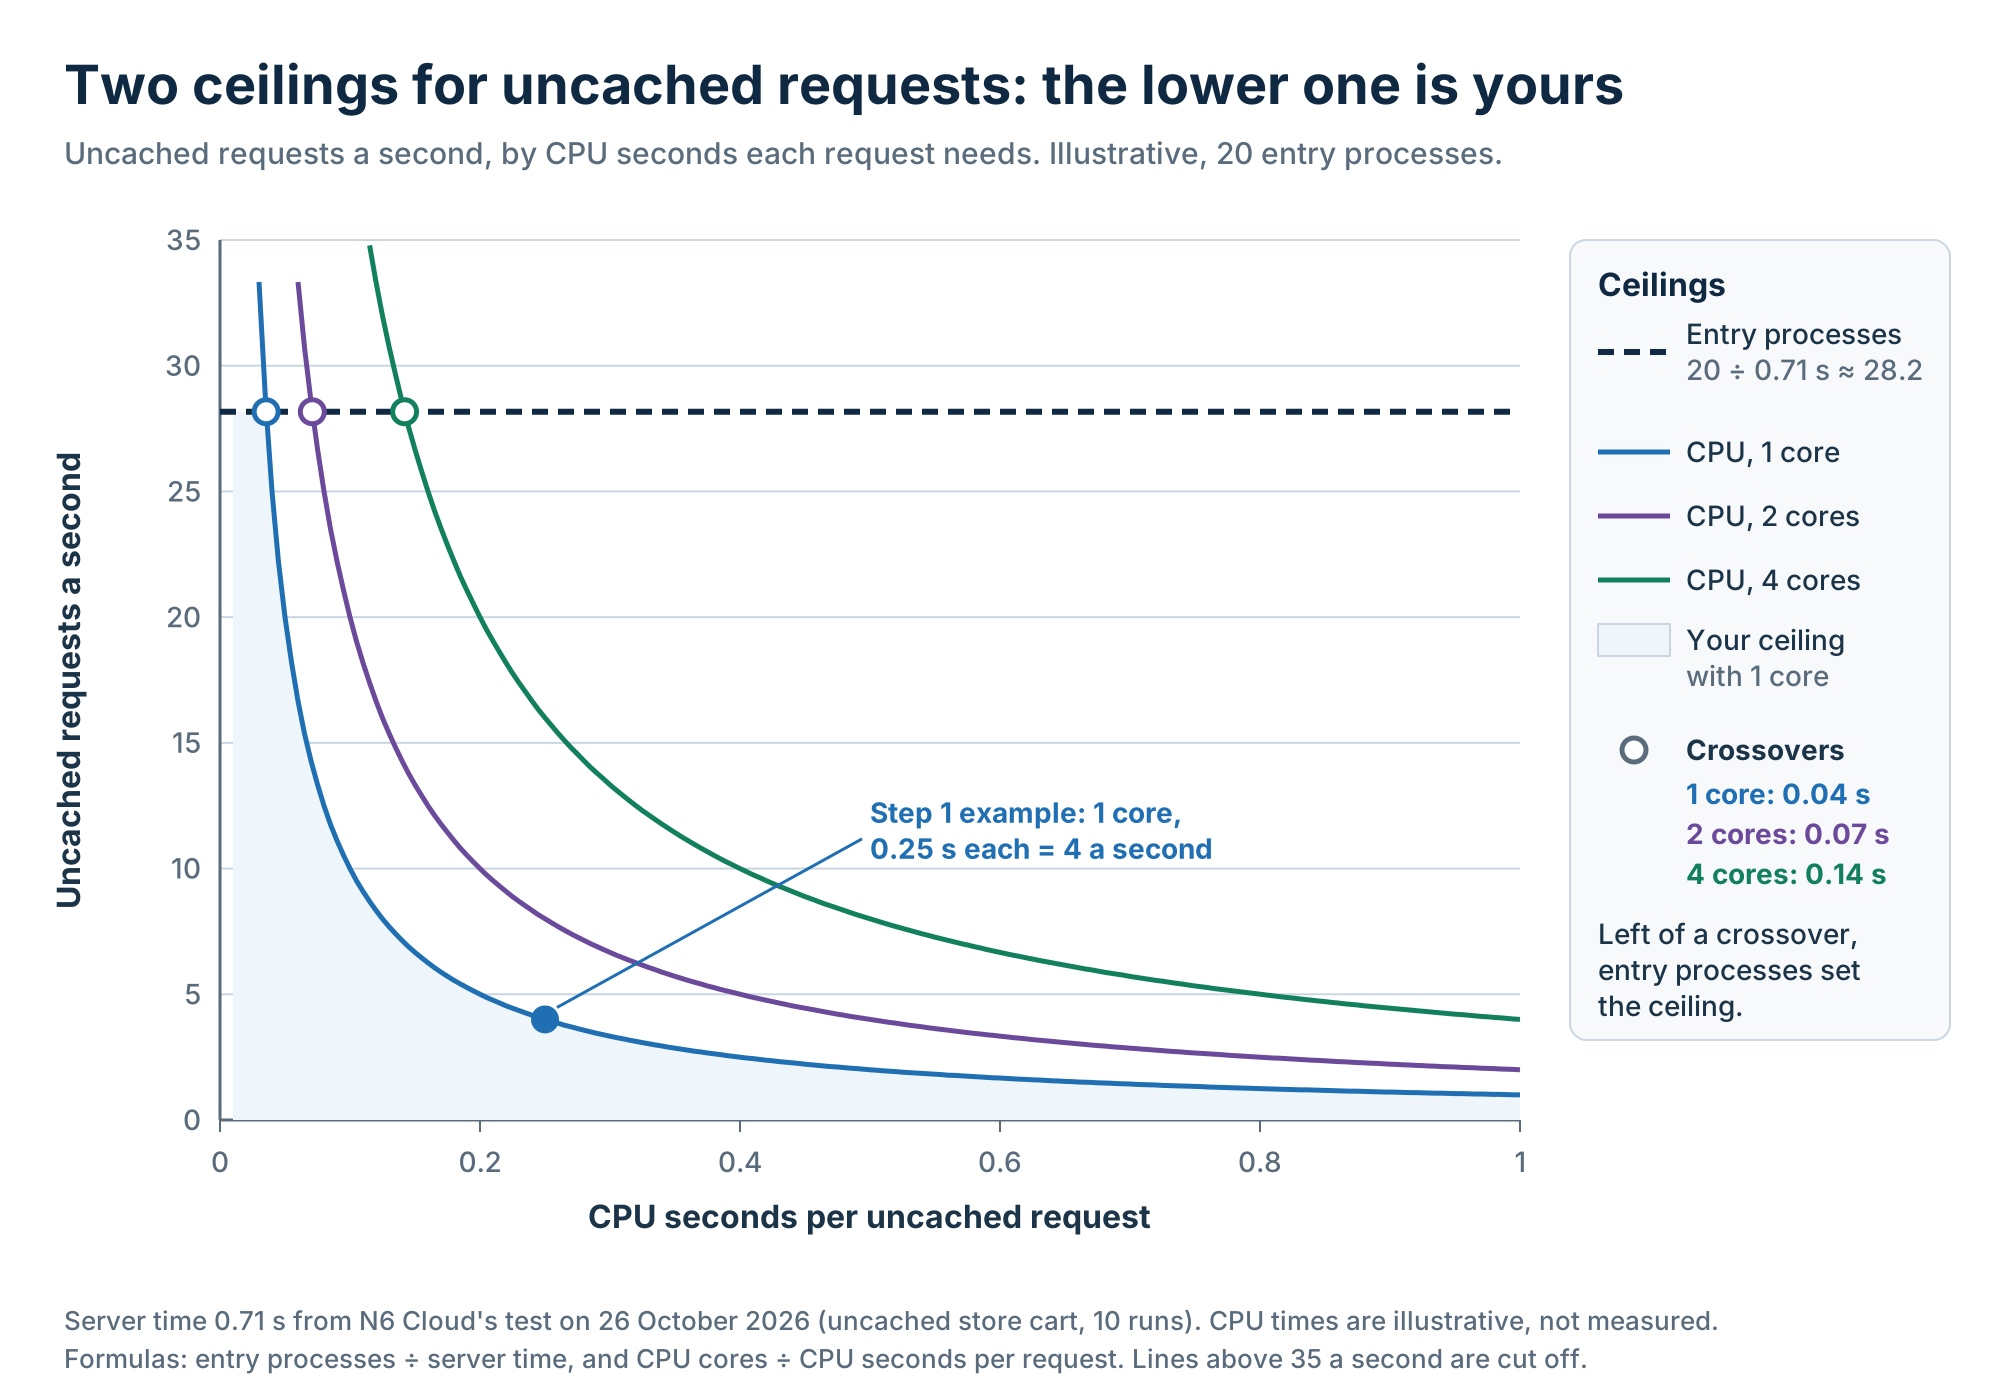
Chart of the entry-process ceiling at about 28 uncached requests a second against CPU ceilings for 1, 2, and 4 cores, by CPU seconds per request. Figure 2. Left of each crossover, the entry-process limit sets your ceiling; right of it, the CPU limit does, and with one core that’s almost everywhere.

Step 2: Divide by the Share of Page Views Your Cache Misses

Pages served from a server-level page cache barely touch your limits, so the share of page views that miss the cache decides how many visitors your ceiling supports. In kitchen terms, plated dishes go out without lighting a burner. If your cache hit rate is 80%, the miss share is 20%. Divide the Step 1 ceiling by the miss share: 4 ÷ 0.2 = 20 page views a second when 20% miss. Some pages almost always miss: logged-in pages, the cart, checkout, search results, form submissions, and the background (AJAX) calls a page makes after it loads. That’s why stores sit low in the table below: WooCommerce hosting carries each shopper through pages no cache can hold.

With Step 1’s ceiling of 4, three illustrative sites look like this:

Site type Page views that miss the cache (assumed) Page views a second Page views a minute
Cached blog
5%
80
4,800
Company site with forms and search
20%
20
1,200
Small online store
40%
10
600

Illustrative. Assumes page views spread evenly through the minute and cached pages served by the web server without starting PHP.

The gain is steepest near the top. Going from 95% to 99% of views from cache multiplies capacity by five (Figure 3), so chasing the last uncached pages often beats a bigger plan. Your caching plugin’s exclusion settings show which pages it never caches, and those are where to start.
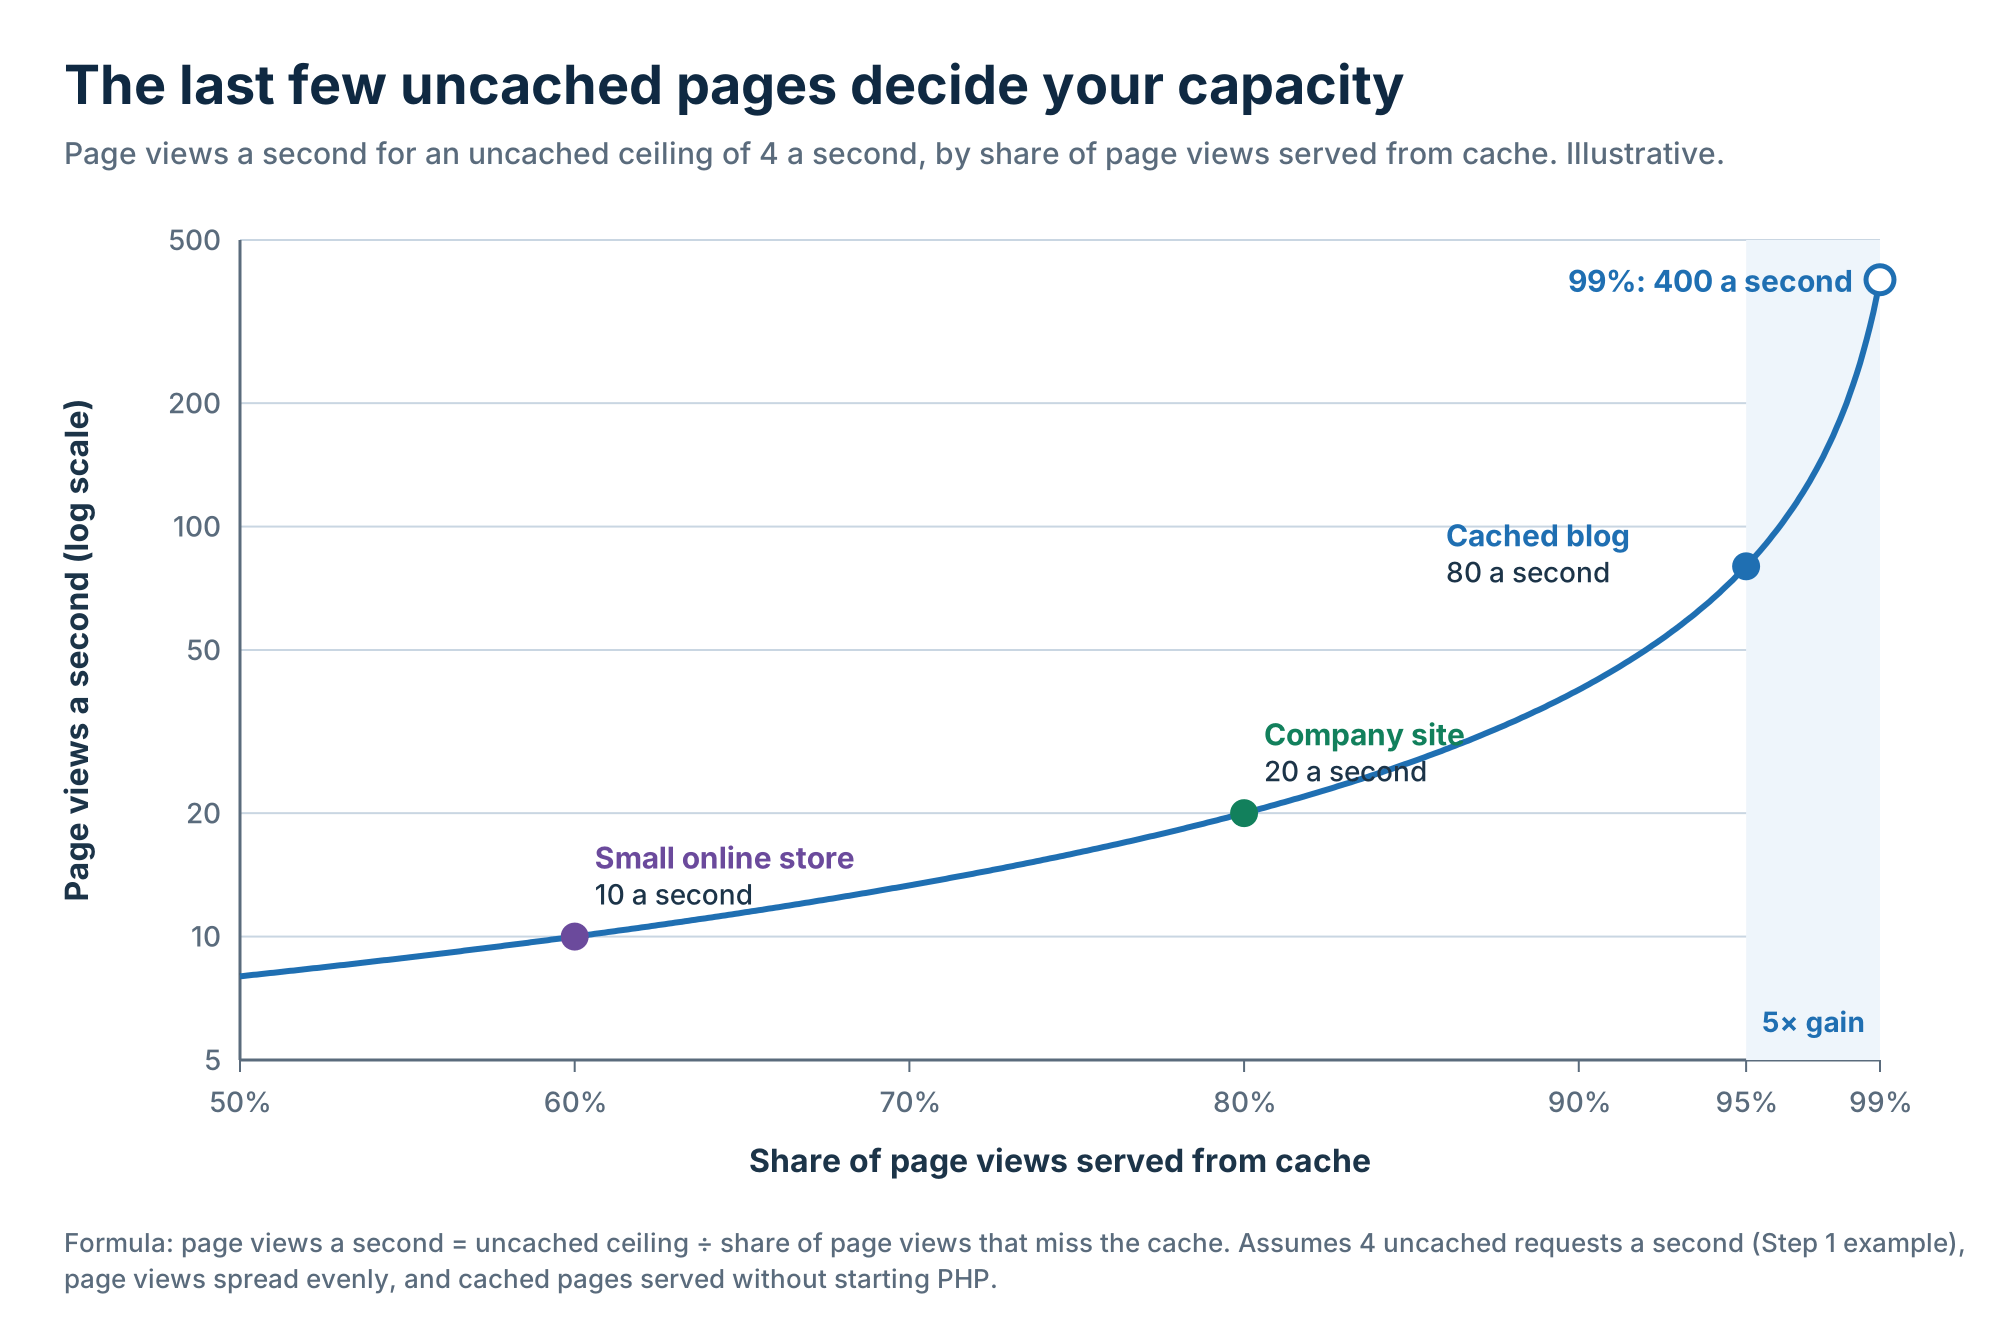
Curve of page views a second against the share of page views served from cache, rising from 10 at 60% to 400 at 99% for an uncached ceiling of 4.Figure 3. The three site types from the table on one curve: capacity depends on the share of page views your cache serves.

Step 3: Take Out Bots and AI Crawlers

Bots, from search engines to AI crawlers, also use your limits when they request pages that run PHP. On 2 December 2025, people made 47% of HTML requests on Cloudflare’s network, and non-AI bots 44%, according to Cloudflare’s year-end review for 2025. Your site’s mix will differ. A bot reading cached pages costs little. Search and filter pages run PHP on every visit. Login attacks on wp-login.php and xmlrpc.php are among the costliest, since each attempt runs PHP and the database. If bots make a third of the store’s uncached requests, its 10 page views a second drop to about 6.7 for people.

Start by blocking bad bots and brute-force logins. A robots.txt file keeps crawlers that obey it out of search and filter pages, but Google ignores its crawl-delay line, according to Google’s robots.txt specification. If Googlebot itself is the load, Google’s guide to reducing crawl rate describes an emergency brake. It’s for hours or a day or two, not a standing setting, and most small sites never need it.

The estimate needs six numbers, and here’s where to find each:

Number Where to find it
Entry-process limit
The Limit column for entry processes on cPanel’s Resource Usage page (next section), or ask your host
CPU cores
The Limit for SPEED on the same page (100% is one core), or your plan page
Server time per uncached page
A plugin such as Query Monitor shows page generation time; or, in your browser’s network tab, an uncached page’s waiting time minus a cached page’s
CPU seconds per uncached page
Rarely shown to site owners; if you can’t measure it, use your server time, since one PHP request runs on one core and can’t use more CPU time than it takes to finish (a cautious, low ceiling)
Share of page views that miss the cache
In your analytics, logged-in, cart, checkout, search, and booking pages as a share of page views; if unsure, start with 40%
Bot share of uncached requests
The robots section of AWStats in cPanel’s visitor statistics, as a rough guide since it counts cached and uncached requests alike; if unsure, use a third, as in Step 3

Take the lower Step 1 ceiling, divide by the miss share, and multiply by one minus the bot share. Here’s how that plays out in a burst, with every input assumed for illustration. A studio emails 2,000 subscribers, and 80 of them (4%) click within the same 20 seconds, viewing two pages each. That’s 160 page views in 20 seconds, or 8 a second, and if half are booking pages the cache can’t hold, 4 uncached requests a second reach PHP. That’s already the one-core ceiling from Step 1. Add bots at a third of uncached requests, and the total is 6 a second, so pages slow down, each request holds its slot longer, and a burst like this can end in 508s.

How to Check Whether You’re Hitting Your Limits

On a CloudLinux server, cPanel’s Resource Usage page (usually in the Metrics section, sometimes named CPU and Concurrent Connection Usage) shows each limit, your use of it, and how often you hit it. Check it before changing anything. The fault counts name the limit behind the problem, so you can fix that before paying for more.

Reading the cPanel Resource Usage Page

The page exists only on CloudLinux servers, as the cPanel Resource Usage documentation notes, and its Dashboard tab says whether the site was limited in the last 24 hours. On the Current Usage tab, each limit gets one row and three columns, as CloudLinux’s Resource Usage guide describes. Usage is what you used, Limit is your ceiling, and Fault is how many times you hit it. A history table repeats these as A, L, and F (average, limit, and faults) for each period.

Averages mislead: in CloudLinux’s example, one second at 100% CPU averages to 1% to 2% for that minute. Read the Fault column against Table 1 instead: EP faults explain 508s, PMEM and NPROC faults explain 500s and 503s, and SPEED, IO, or IOPS faults explain slow pages. Then open the Snapshot tab, which records what was running just after a fault and usually points to the plugin, slow query, or URL behind it.

Quick Fixes Before You Upgrade

Most limit faults on small sites have a few fixable causes. For EP and SPEED faults, turn on page caching, then use Snapshot to find the slow plugin or query and replace it. On a LiteSpeed server, see the guide to setting up LiteSpeed Cache on WordPress.

Move backups, imports, and image regeneration to quiet hours to stop I/O faults. Memory faults point to a heavy plugin, and a higher memory_limit only lets each script take more of the same total. For inode warnings, clear old cache folders, stored backups, and old email. WordPress also runs its scheduled tasks (WP-Cron) when visitors load pages. You can turn that off with one line in wp-config.php and have cPanel’s Cron Jobs tool run the tasks on a timer instead, such as every 15 minutes.

The plan’s web server matters too. When the web server caches pages itself, cached pages never start PHP or use your entry processes. When you compare plans, fast shared hosting with server-level caching, such as LiteSpeed’s, leaves more of your uncached ceiling for pages that need it.

When Your Limits Say It’s Time to Move On

It’s time to move when faults keep coming after the fixes and your Step 1 ceiling sits below what your busiest minutes need. Faults are one of the signs your site has outgrown its plan. Before choosing the next plan or host, get its limits in numbers.

Questions to Ask a Host Before You Buy (Decoding “1x Resources” and “Unlimited”)

Labels such as “1x Resources” or “unlimited” mean little without a base number. “2x Resources” is only twice something once you know what that something is, and a written number is one you can plan around. These eight questions cover every limit in Table 1, and each answer feeds the estimate or the checks above:

  1. What’s the CPU limit in cores or percent? It sets your CPU ceiling in Step 1.
  2. How much physical memory does each account get? It caps how many PHP scripts can run at full size.
  3. What’s the entry-process limit, and on LiteSpeed or PHP-FPM, the per-account PHP limit? Both cap PHP requests at once.
  4. What’s the process limit (NPROC)? It should sit well above the entry-process limit.
  5. What are the I/O limit (in KB/s or MB/s) and the IOPS limit? They decide how much backups and imports slow live traffic.
  6. What’s the inode limit, and is it hard or soft? It matters most for image-heavy sites and stored email.
  7. Which web server and page cache come with the plan, and do cached pages skip PHP? This sets your Step 2 multiplier.
  8. Are the limits the same for every account on the plan? Shared accounts on one plan should get the same ceilings.

What Your Fault Pattern Says About the Next Server

Your fault history shows what kind of extra capacity to buy. Entry-process or CPU faults at most hours of the day mean the site needs more capacity all the time, which points to VPS hosting, a virtual server with cores and memory reserved for you. Faults that bunch around campaigns, launches, or seasonal peaks point to a server you can resize for those weeks, such as cloud hosting.

Step 1’s numbers size either one: multiply your peak uncached requests a second by CPU seconds per request for cores, and by server time for PHP processes. The newsletter burst above peaked at 6 uncached requests a second with bots. With Step 1’s figures, that needs about 6 × 0.25 = 1.5 cores and 6 × 0.71 ≈ 4 PHP processes at once. Add half again for growth, and you’re looking for 2 to 3 cores and about 7 PHP processes. At a memory_limit of 128 MB, those 7 processes could need up to about 900 MB of memory for PHP alone, so check memory too before you upgrade your hosting plan.

Why Trust N6 Cloud to Explain Shared Hosting Resource Limits?

N6 Cloud sells shared hosting, so read this section as a host describing its own plans. Its team has more than 20 years of web hosting experience. The shared plans run in data centres in British Columbia, which keeps your site’s data in Canada and close to visitors in Western Canada. Every shared plan stores sites on SSD SAN storage with RAID 10, which keeps each piece of data on more than one drive.

Every plan also comes with CloudLinux Pro, CageFS, and cPanel. Each account runs inside its own CloudLinux limits, the mechanism this article explains, so you can read your own fault counts. N6 Cloud’s plan pages list CPU cores, memory, and inodes for every shared plan: 1 to 4 cores, 1 to 4 GB of memory, and 500,000 inodes. The other limits in Table 1, including entry processes, appear in the Limit column of your account’s Resource Usage page. N6 Cloud’s higher shared plans run LiteSpeed with server-level caching.

Support is available 24/7. N6 Cloud commits to 99.9% uptime, backed by service credits, and its shared plans come with a 30-day money-back guarantee. That gives you a month to check Resource Usage and run the 3-step estimate with your real traffic. Support staff can walk you through the Resource Usage page and explain any fault count that doesn’t make sense.

Frequently Asked Questions

What does "508 Resource Limit Is Reached" mean?

It means the site was already running as many PHP requests as its entry-process limit allows, so your request was turned away. The error is temporary and clears once running requests finish, often within seconds. It isn’t a CPU or memory limit, since those slow the site or return a 500 or 503.

Does a staging site share my resource limits?

Yes, when the staging copy lives in the same hosting account as the live site. CloudLinux sets limits per account, so both sites share the same CPU, memory, and entry processes, and staging files count toward the same inode limit. Heavy testing or a large copy job can slow the live site.

Do cached pages count against my entry processes?

Not when the web server serves them from its own cache, because PHP never starts. A cache plugin that serves saved pages through PHP is different: PHP starts briefly to find each saved copy, so every view holds an entry process for a moment. Server-level caching saves more of your limit.

Do cron jobs and SSH sessions count as entry processes?

Yes. CloudLinux counts each cron job and each SSH session as an entry process for as long as it runs. A long backup or import job can hold a slot right through a traffic peak, so schedule heavy jobs for quiet hours and avoid running several at once.

Will a plan with more CPU cores make my pages load faster?

Mostly not for a single visitor. One PHP request runs on one core at a time, so extra cores let more pages be built at once rather than making each one faster. More cores help when many people visit together, while one slow page needs a lighter plugin or a cache.

Do emails count toward my inode limit?

Yes. Mail stored on a hosting account is usually saved as one file per message, and each file uses one inode. A mailbox holding years of mail can use tens of thousands of inodes, so deleting old messages or moving mail to a separate email service frees room quickly.

Can resource-limit errors hurt my Google rankings?

Short episodes usually don’t do lasting harm. Google’s documentation says server errors make its crawlers slow down for a while, and pages already indexed are kept at first. If pages keep returning errors such as a 508 for days, Google can eventually drop them from its index, so fix repeated faults quickly.

Does a CDN reduce my shared hosting resource usage?

Partly. A CDN (content delivery network) serves images, CSS, and scripts from its own servers, which takes that work off your account. Cloudflare, for example, doesn’t cache HTML pages by default, so page requests still reach PHP unless page caching is set up at the CDN or on your server.

Related Posts