

Pages load fine all week, then crawl every Monday morning, and the CPU graph in your control panel turns red. Buying the next size up may fix it, or it may double the bill and leave the real bottleneck in place. Cloud server scaling works better as a decision made from evidence, and its central choice, vertical vs horizontal scaling, comes down to one bigger server or more servers sharing the work. N6 Cloud’s team wrote this guide, with its own measurements, in the order that saves the most money. Read your graphs, fix the cheap things, pick a direction, count the cost, and plan the way back down.

What Cloud Server Scaling Actually Means
Scaling up adds more vCPU, RAM, or disk to one server, while scaling out adds servers that share the work behind a load balancer. Vertical scaling, the formal name for scaling up, keeps the same machine, address, and data, and changes only its size through a resize, which usually means a restart. Horizontal scaling, or scaling out, leaves each server’s size alone and adds more copies of it.
A load balancer receives every visitor’s request and passes each one to a server with room to spare. Think of a supermarket that opens more checkouts at a busy hour: one long lineup splits across several tills, and one till closing doesn’t close the store. Each extra server is one more checkout.
Much of the confusion around scale up vs scale out comes from having many names for two moves. The reverse moves are scaling down (a smaller size) and scaling in (fewer servers). Doing both at once is called diagonal or hybrid scaling, and hourly billing lets you revisit the choice whenever your graphs change.

Reading the Signals: When to Scale a Server
Knowing when to scale a server, and in which direction, is where most owners end up guessing. The answer starts in your monitoring graphs, not in a price list. Work through three questions in order: which numbers are red, for how long, and which resource they point to.
The Five Metrics That Matter: CPU, Load Average, Memory, Disk I/O, and CPU Steal
Five numbers on a Linux server tell you whether it’s short of capacity. Brendan Gregg’s USE Method asks three things of every resource: how busy it is (utilization), whether work is queuing for it (saturation), and whether it’s reporting errors. A CPU at 90% with nothing waiting is busy but coping. A CPU at 100% with a queue behind it is a bottleneck, and the queue is what your visitors feel.
Gregg treats sustained CPU use beyond about 70% as worth watching, because an average over a few minutes can hide short bursts at 100%. Load average counts the tasks running or waiting to run, as three figures for the last 1, 5, and 15 minutes. Read it per vCPU, because a load of 4 is a queue on a 2 vCPU server and spare room on an 8 vCPU one. Gregg notes that most systems suffer at a load of about 2 per CPU.
Memory runs short when the server starts moving memory out to disk and back in small blocks called pages, which Linux calls swapping. Watch swap activity, not how much swap is used. Disk trouble often shows up as iowait, the time the processors sat idle while waiting for the disk. Because iowait is unreliable, a firmer disk signal is latency (how long each disk request takes) or the queue of requests waiting, and iostat -x from the sysstat package shows both. CPU steal is time your virtual CPU was ready to run but the host gave its turn to another virtual machine.
Treat the thresholds in Table 1 as rules of thumb, not laws, and read each with its caveat. Many administrators also wait until a number stays high for about 15 minutes, a habit that matches the longest load average rather than a published rule. Most provider panels graph CPU and memory, while load average, swap activity, and steal usually need a command on the server, such as top or vmstat 5. To see whether a server has swap, run free -m: a Swap total of 0 means none, so watch available memory instead. The guide to commands that show CPU and memory use shows where to find each number.
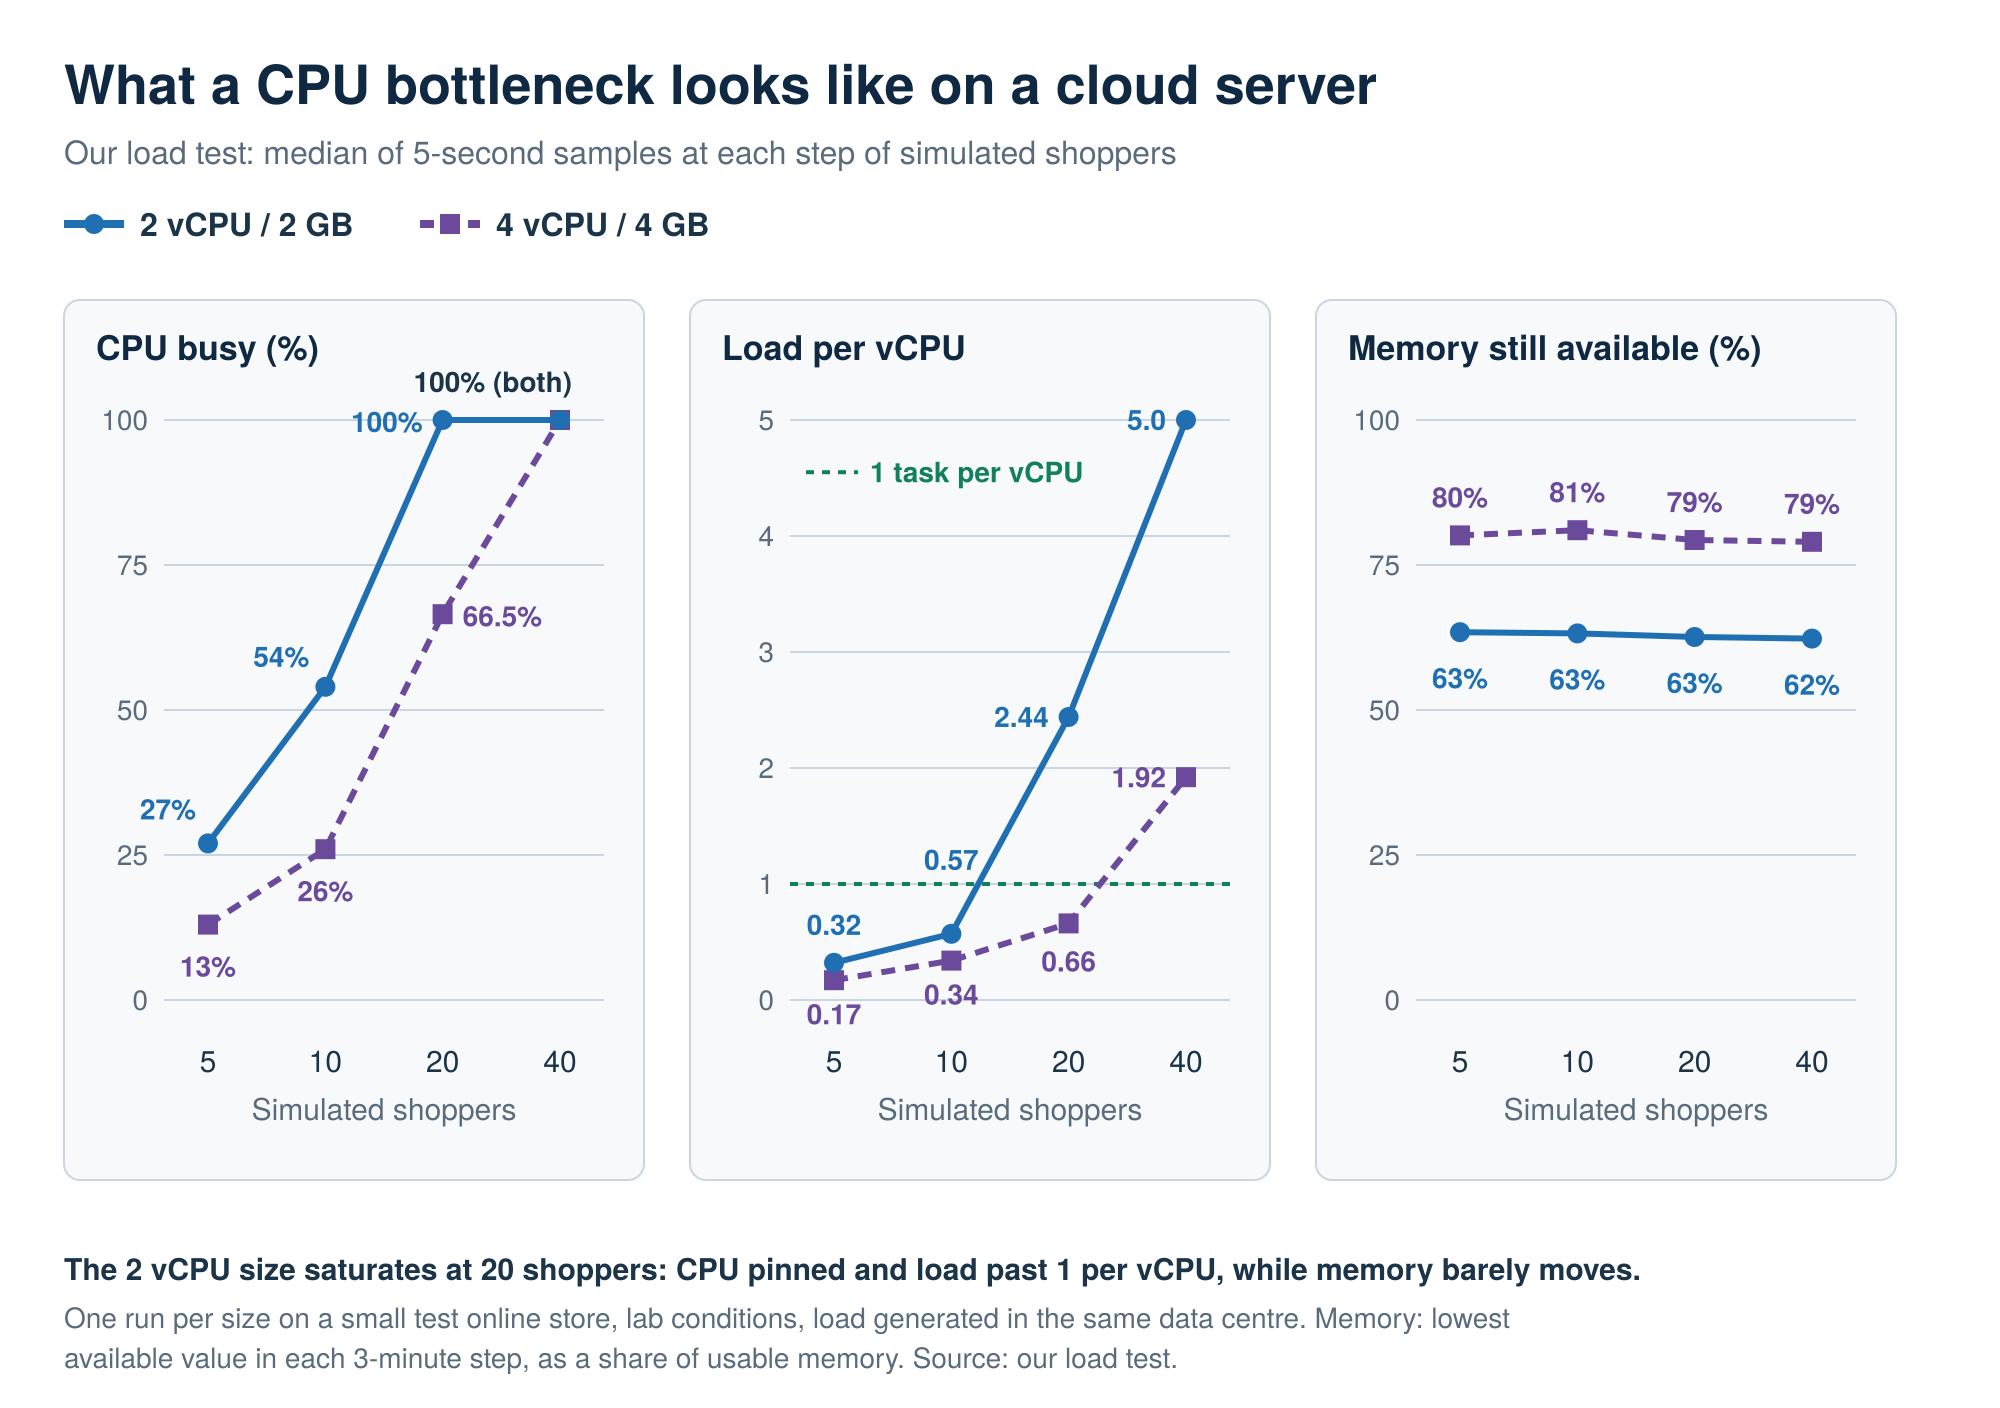
In our test, a 2 vCPU / 2 GB cloud server ran a small test online store while simulated shoppers browsed it and checked out in steps of 5, 10, 20, and 40. At 10 shoppers, the server was comfortable, with CPU at 54% and a load of about 0.6 per vCPU. At 20 shoppers, CPU hit 100%, and load reached about 2.4 per vCPU, and pages the cache couldn’t serve slowed sharply while cached pages stayed fast. Through every step, available memory never fell below about 1.2 GB of the server’s 2 GB, and iowait never went above 9%.
The bottleneck was CPU, and the next size up, 4 vCPU / 4 GB, held 20 shoppers at about two-thirds CPU. The limits: one test store, lab conditions, one run per size, and load generated in the same data centre. Figure 1 shows the pattern to look for on your own graphs.
Our second test measured the wrong upgrade directly. A CPU-heavy page served 7.0 requests a second on 2 vCPU / 2 GB and 7.0 on 2 vCPU / 4 GB. Their p95 response times were 670 and 676 ms, meaning 95 of every 100 requests took this long or less. On 4 vCPU / 4 GB, it served 13.3 a second, about 90% more, at 329 ms. Doubling memory changed nothing, and doubling vCPU nearly doubled throughput, on one synthetic page under the same fixed load of four simultaneous requests, with three runs per size.
Before You Scale: Cheap Fixes Most Guides Skip
A red metric doesn’t always mean you need more capacity, because the cheaper move is often to make the server do less work. Caching keeps ready copies of pages or query results, and a content delivery network (CDN) serves images and other static files from servers closer to your visitors. Both take repeated work off your server, and the guide to caching layers that cut server load compares the options.
Three other causes are cheap to check. A slow database query, such as one missing an index so it reads the whole table on every request, can pin a CPU by itself. Too many worker processes (the copies of your app that handle requests side by side) for the RAM push a server into swapping. Backups, reports, or imports often run at the busiest hour only because nobody moved them.
Then apply a stop rule. Write the numbers down before each change, and measure again after a normal week at the same busy hour. If the same metric is still above its rule of thumb, stop optimizing and scale; the upgrade guide shows how to baseline and validate an upgrade.
Vertical vs Horizontal Scaling: Pros, Cons, and a Side-by-Side Table
When the numbers are still red after the fixes, the question becomes which direction to grow. Vertical scaling is simpler and usually enough for one or a few servers, while horizontal scaling buys fault tolerance and room to grow at the price of more moving parts. Most horizontal vs. vertical scaling decisions come down to what an outage costs you and whether your app can run on more than one machine. Table 3 compares the two.
Where Vertical Scaling Wins
Vertical scaling in the cloud is the simplest fix when your app keeps its state on one machine, because nothing in the code has to change. Databases, older all-in-one apps, and apps that keep sessions or uploads on the local disk fit here. One bigger server still means one system to patch and watch, and a cloud server you can resize from the panel changes size without a migration or new code.
The price is a short outage at each resize. On many providers, resizing a cloud server restarts it, though some can add CPU and memory while it runs. In our tests, each resize shut down the server, and it stayed off until someone started it again, so the outage was a few minutes.
Plan for that before you start. Pick a quiet hour, expect to start the server again yourself on some platforms, and keep checking its status in the panel until it’s running and your app answers. The other limit is the ceiling: once you’re on the largest size a provider offers, the only way left to grow is out.
Where Horizontal Scaling Wins
Horizontal scaling in the cloud removes the single point of failure, the one machine whose loss takes everything down with it. With two servers behind a load balancer, one failing or being patched no longer means the site is offline. The load balancer runs a health check, a quick test it repeats on each server every few seconds to half a minute, depending on its settings. It stops sending visitors to any server that fails it.
That health check also changes how resizes work. In N6 Cloud’s test, two 2 vCPU / 2 GB servers sat behind a load balancer, a probe sent one request a second, and each server was resized in turn. Across five resizes, the median was 3 failed requests per resize (range 0 to 3), all within about 11 seconds, while the other server kept answering. That server carried all traffic until the resized one came back online and passed its health check. Each server therefore needs enough spare capacity to carry the whole load alone during a resize. On a single server, the whole site was down for the few minutes described above.
Growth comes in small steps too: you add one small server when the peak rises instead of jumping to a size twice as large. Each new server joins once it passes the health check, without interrupting the others. Small steps also make the quiet-month saving in the worked example below possible.
The catch is that the app must run correctly on any server, which is called being stateless. Sessions need to live in one central store, such as a shared cache or the database, and uploaded files need to live in one shared place rather than on each server’s disk. Scheduled jobs need to run on one server only, or every server will send the same report.
A Quick Decision Checklist
Five yes/no questions turn the table into a direction for your own setup. Answer them for the app you run today, not the one you hope to run next year, and be strict about the first one. Each answer says which way it points.
- Can your app run on two servers today without code changes? Yes points to scaling out; no means scaling up is the faster fix.
- Would an hour offline cost you more than a month of running a second server, including the time to look after it? Yes points to planning a second server.
- Is your current size within two steps of the largest on offer? Yes means start preparing to scale out now.
- Does your busy hour stay busy every day, not only during campaigns? Yes means a permanent move; no suggests a temporary resize.
- Is the database the bottleneck rather than the web servers? Yes means start with the database (see “Combining Both Approaches as You Grow”).

How to Grow Without Overpaying: The Cost Side of Scaling
With a direction chosen, the next worry is the bill, and this is where most cloud server scaling advice turns vague. Cost has three parts: capacity, runtime, and what you stop paying for when the peak passes. Each part can change the answer the table suggests.
One Big Server vs Two Small Ones: A Worked Example
When compute price rises in step with size, two half-size servers cost about the same in compute as one server twice the size. The real difference comes from what sits around the compute: a second disk, a load balancer, and your time. Table 4 uses hypothetical rates, for illustration only, to compare one 8 vCPU / 16 GB server with two 4 vCPU / 8 GB servers over a 30-day month (720 hours).
Compute differs by only 4%, yet the monthly bill is about 23% higher, and admin time is the biggest line: a second operating system to patch, more alerts, and sometimes a second licence. With a provider that includes the load balancer at no extra charge, the monthly gap drops to CAD 7.88, the second disk plus 4% more compute, and your time becomes almost the whole difference. Your own numbers come from your provider’s price list. Two servers also don’t add up to one big one, since no single process can use both servers’ RAM; that’s why combined memory isn’t usable memory.
The last line is what horizontal scaling buys back. In a quiet month, you can remove one server and pay CAD 52.44, less than the big server, though with no spare while one runs alone. At small scale, one big server is usually cheaper to run. Two small servers pay off when an hour of downtime costs more than the extra CAD 17.88 a month plus your time, or when you’re close to the largest size on offer.
Scaling Back Down After a Peak
Hourly billing only saves money if you size down after the peak. The right moment is after a week or two back at normal levels, when the busiest hour would still sit under its rule of thumb on the smaller size. For example, CPU at 30% on 8 vCPU works out to about 60% on 4 vCPU, under the 70% line from Table 1.
Make that check a habit, called right-sizing: matching the server’s size to what the graphs show it uses, each month or after each busy season. Before every resize, take a disk-only snapshot, a saved copy of the disk that you can go back to. On some platforms, a snapshot that also saves the server’s running memory can’t survive a resize. In N6 Cloud’s test, a disk-only snapshot finished in under half a minute while the site kept running.
CPU and memory can usually come back down, though some providers need the server stopped first. Disk is the one part you can’t take back: on most platforms, including N6 Cloud, a disk can only grow. Add disk space last, only when you’re short of storage rather than speed, since a smaller disk later means building a new server and moving your data.
Manual, Scheduled, or Automatic Scaling: Which Fits Your Stage?
Most small teams only need to resize by hand, and predictable peaks suit a schedule. Manual scaling means you watch the graphs, decide, and resize at a quiet hour, which is enough for one to a few servers. Scheduled scaling adds capacity before a peak you know is coming, such as month-end reporting, and removes it afterwards. For a weekly peak, a schedule only makes sense with a load balancer, so you can add one server before the peak and remove it after without taking the site offline.
Automatic scaling, often called auto scaling, is a set of rules that adds or removes capacity when a metric crosses a line you set. It can be vertical or horizontal, but most setups add and remove servers, because a new server joins without restarting the others. That only works once the app is stateless.
Kubernetes, the most common tool for running containers across many servers, usually handles automatic scaling. Its Kubernetes Horizontal Pod Autoscaler adds or removes copies of your app’s containers (Pods) and checks your metrics every 15 seconds by default. It also waits five minutes by default before scaling down, so a short dip doesn’t remove capacity too early.
Kubernetes earns its complexity when you run many containers, not one app on two servers. Until then, a load balancer plus a manual or scheduled plan does the job with far less to learn. Later, the guide to deploying Kubernetes on cloud servers covers the setup.
Combining Both Approaches as You Grow
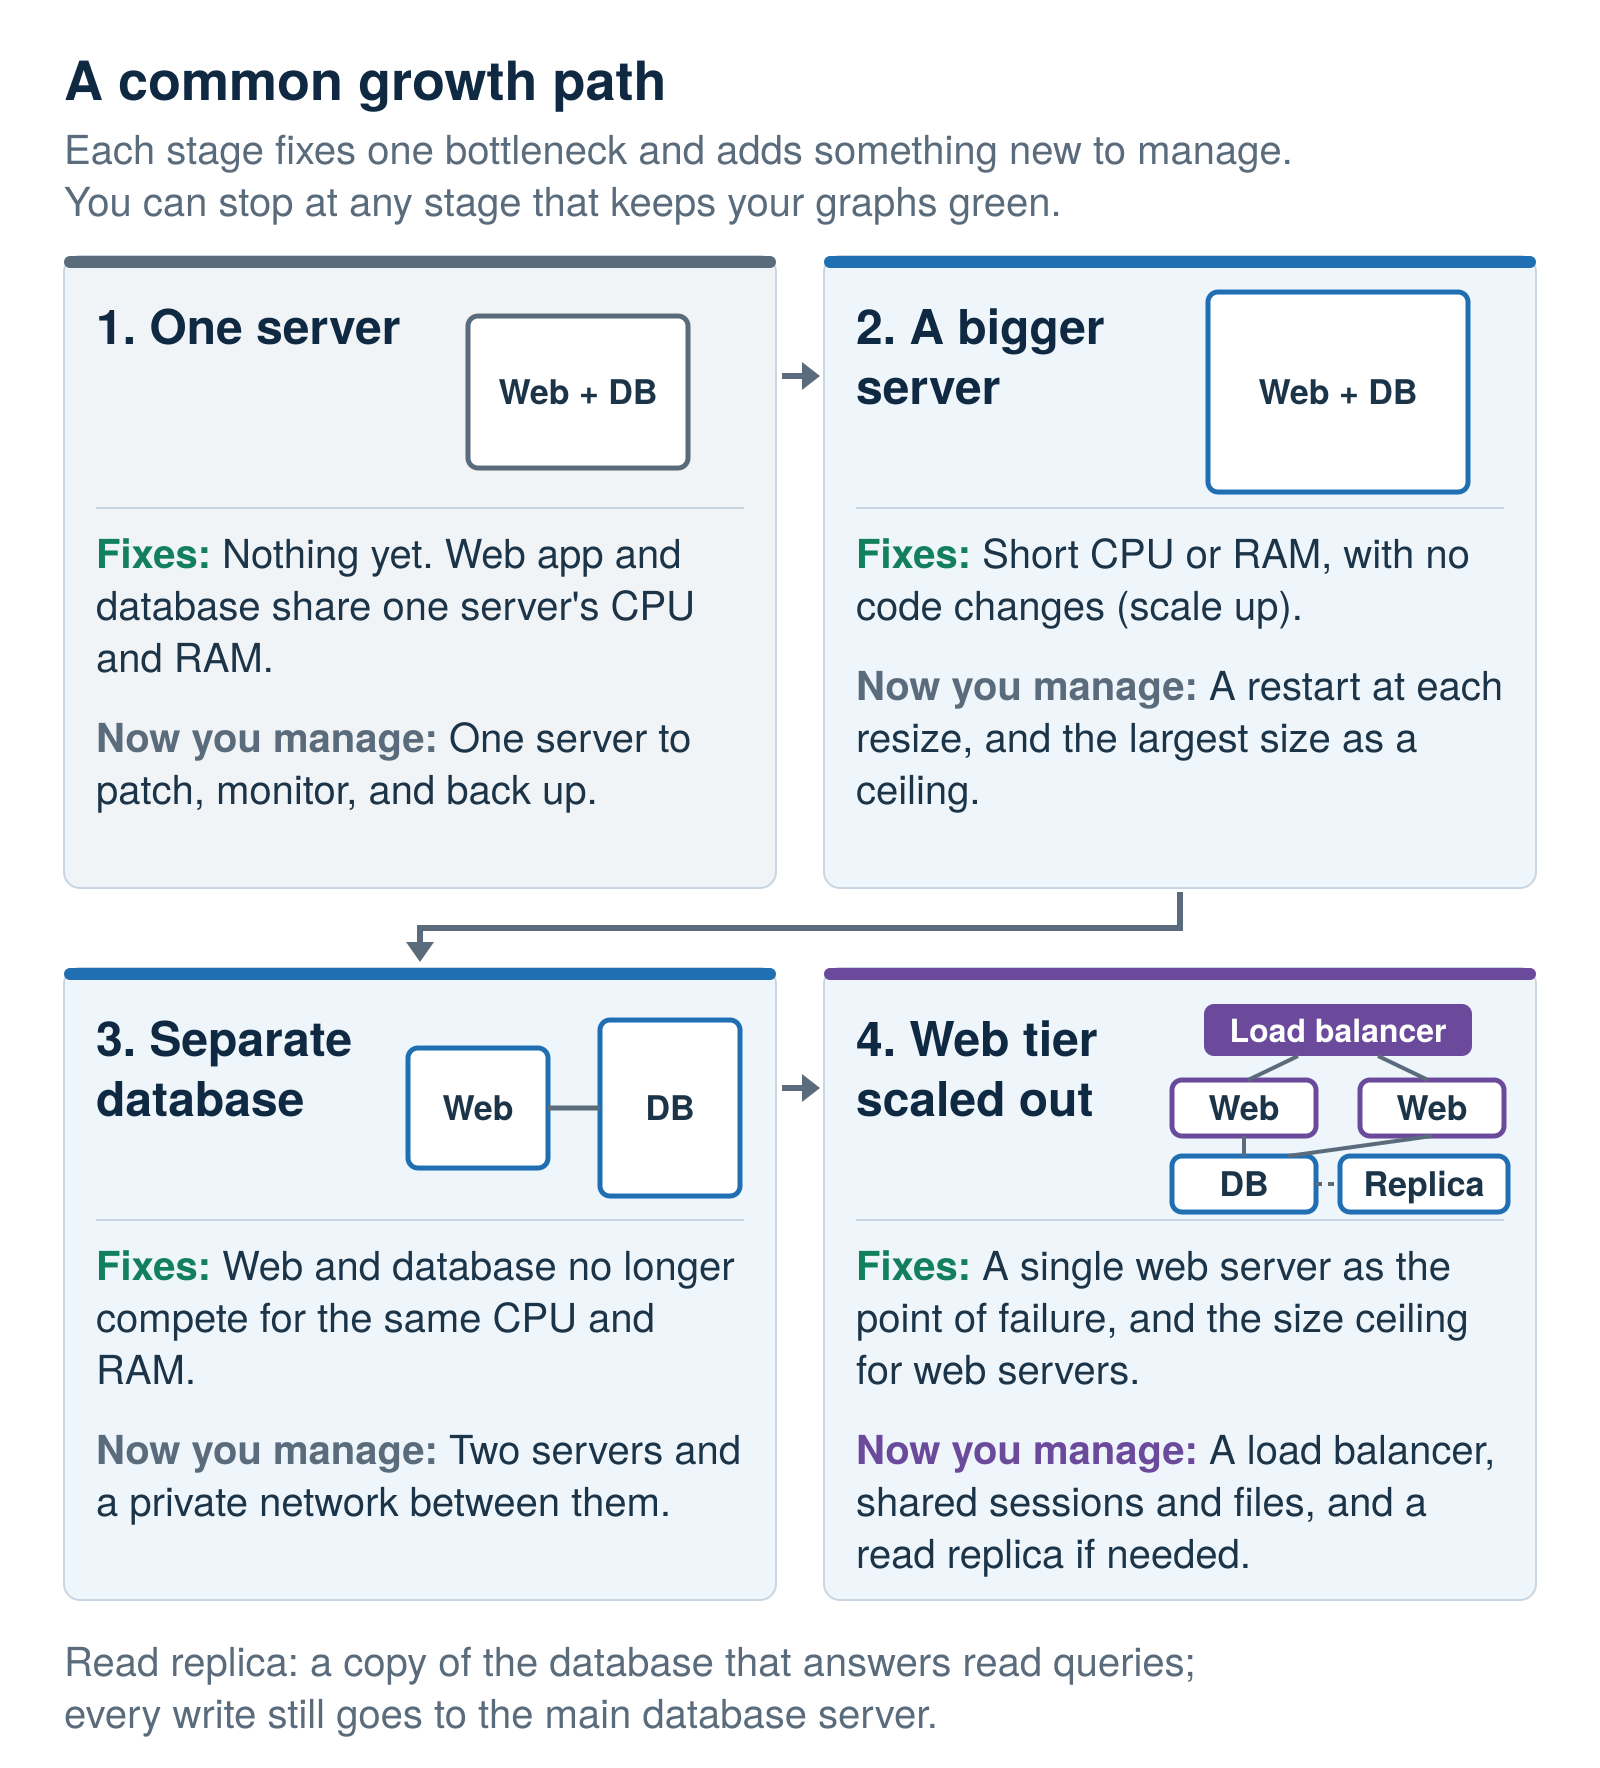
Few teams pick one approach forever. Most growing setups scale up first, then move the database to its own server once web and database processes compete for the same CPU and RAM. A common halfway setup keeps the database on one of two web servers, so resizing that server takes the database down too. Move the database to its own server first, connected over a private network, a connection between your servers that doesn’t cross the public internet. When the web servers outgrow their largest sensible size or an outage costs too much, two or more of them go behind a load balancer.
Databases usually keep scaling up, because splitting one is much harder than splitting web servers. The next step is read replicas: copies that answer read queries while every write still goes to one main server, the primary. Sharding, which splits the data itself across servers, is rarely worth its complexity for a small business. Until a replica can take over from the primary, the database is still a single point of failure, so keep tested backups.
This mixed path is diagonal scaling in practice, and each step fixes the bottleneck the previous one exposed. Figure 2 shows the four stages, what each fixes, and what you then have to look after. You can stop at any stage that keeps your graphs green.
Why Trust N6 Cloud for Cloud Server Scaling?
N6 Cloud is a Canadian company based in British Columbia, and its cloud servers are hosted in Vancouver, so the servers and their disks sit in a Canadian data centre. You can create, resize, and remove servers from the control panel without placing a new order, billed by the hour for what you use. Disks sit on SAN storage on RAID 10 SAS SSD arrays, and up to three snapshots are free.
The pieces for scaling out sit in the same panel. Load balancers come at no extra charge, so the worked example’s second server adds no load balancer fee. Private networks connect a separate database server to your web servers. Firewall rules sit alongside them, and support is available 24/7.
If your graphs now tell you which way to grow, the next step in cloud server scaling is a server sized to match them. N6 Cloud’s hourly cloud hosting lets you start at a modest size, watch the numbers this guide describes, and add capacity or servers one step at a time. Scaling out can wait until your graphs show you need it.