
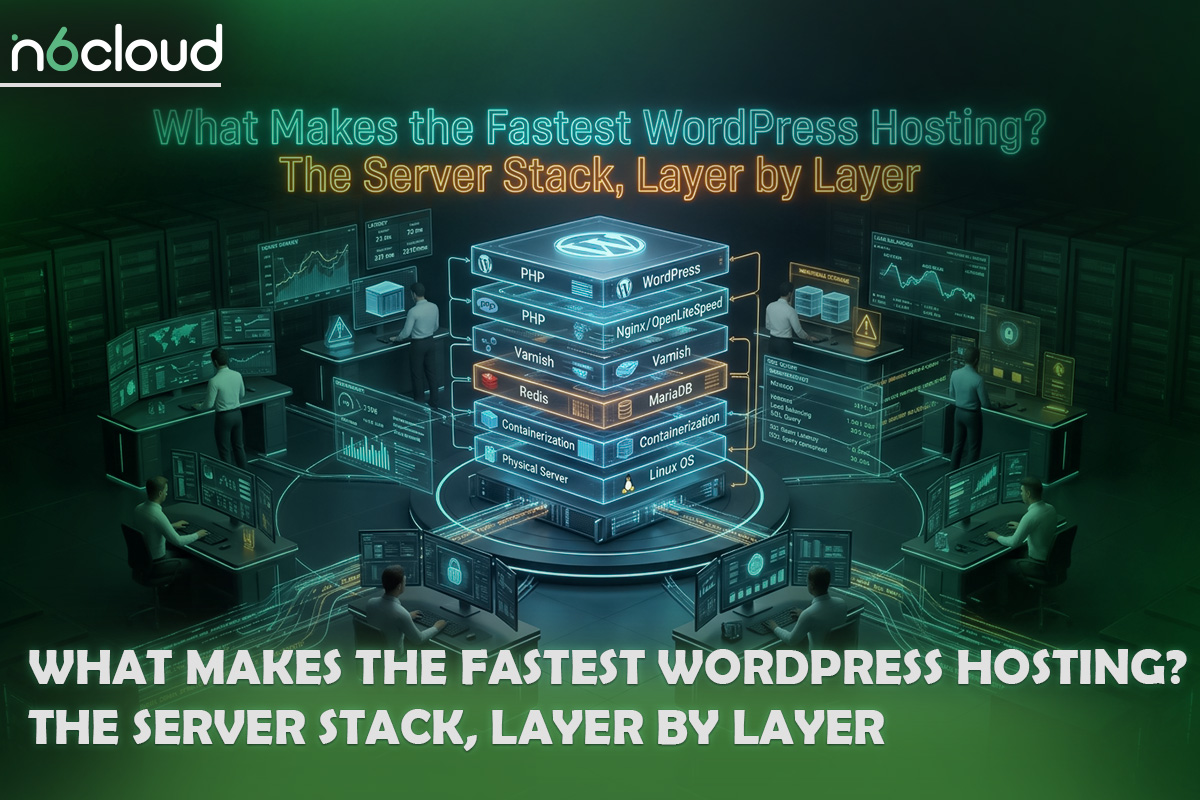
Your homepage scores well in PageSpeed Insights, yet customers say the cart drags and wp-admin crawls every time you add a product. That gap is common on hosts sold as the fastest WordPress hosting, and you can find its cause. WordPress hosting speed doesn’t come from the web server’s brand but from several layers, from the network to the PHP and database work that builds an uncached page. Follow one request from DNS lookup to database and back, with timings measured on N6 Cloud’s own test site, to see which layer spends the time.
What “Fastest” Really Means: Sub-Second Is a Budget, Not a Badge
For a host, fast means a short time to first byte on every page, cached or not, measured from the cities where your visitors live. “Sub-second” is a realistic target for that server response, not for the whole page, which still has to download and appear. The clock comes first, then the budget.
TTFB, LCP, Fully Loaded: Which Clock Should You Trust?
TTFB is the clock the host controls, so judge a host on TTFB and judge your site on LCP. TTFB, or time to first byte, is how long the browser waits before the server’s answer starts to arrive. Largest Contentful Paint (LCP) is the time until the biggest image or text block appears, about when the page feels loaded. “Fully loaded” is when the last file finishes, long after the page is usable.
Google’s Time to First Byte guidance counts 0.8 seconds or less as good and anything above 1.8 seconds as poor. LCP is one of Google’s Core Web Vitals and TTFB isn’t, and a good LCP is 2.5 seconds or less for three visits in four. TTFB starts the LCP clock, so server time comes out of the page’s budget. A 0.8-second TTFB leaves only 1.7 seconds for the rest of the page.
Fully loaded time misleads because it waits for ad networks, chat widgets, and trackers the host never touches. One marketing script can add whole seconds to it. A test that leads with it mostly measures your third-party tags, so read its TTFB and LCP lines.
The 1,000 ms Budget: Where Every Millisecond Goes
A sub-second TTFB is a budget shared by distance, connection setup, and server work, and only some of those stages belong to the host. Before any WordPress code runs, the browser must find the server and open a secure connection. Each step costs at least one round trip: the time it takes for a message to reach the server and return.
Table 1 lists each stage, its approximate time, what sets it, and who controls it.
Distance is the part no setting can remove. From a server in Vancouver, a round trip takes about 53 ms to Toronto and about 148 ms to Frankfurt (WonderNetwork’s medians over two weeks of hourly pings). A new HTTPS connection needs three round trips before the first byte arrives, about 160 ms from Toronto and 445 ms from Frankfurt, plus whatever time the server spends building the page.
The render row is where the host stops controlling the clock. A heavy page builder, oversized images, or third-party scripts can use up the whole 2.5-second LCP budget, and no hosting plan fixes them. That work belongs to the site, and a separate guide to fixing LCP, INP, and CLS on the site side covers it.
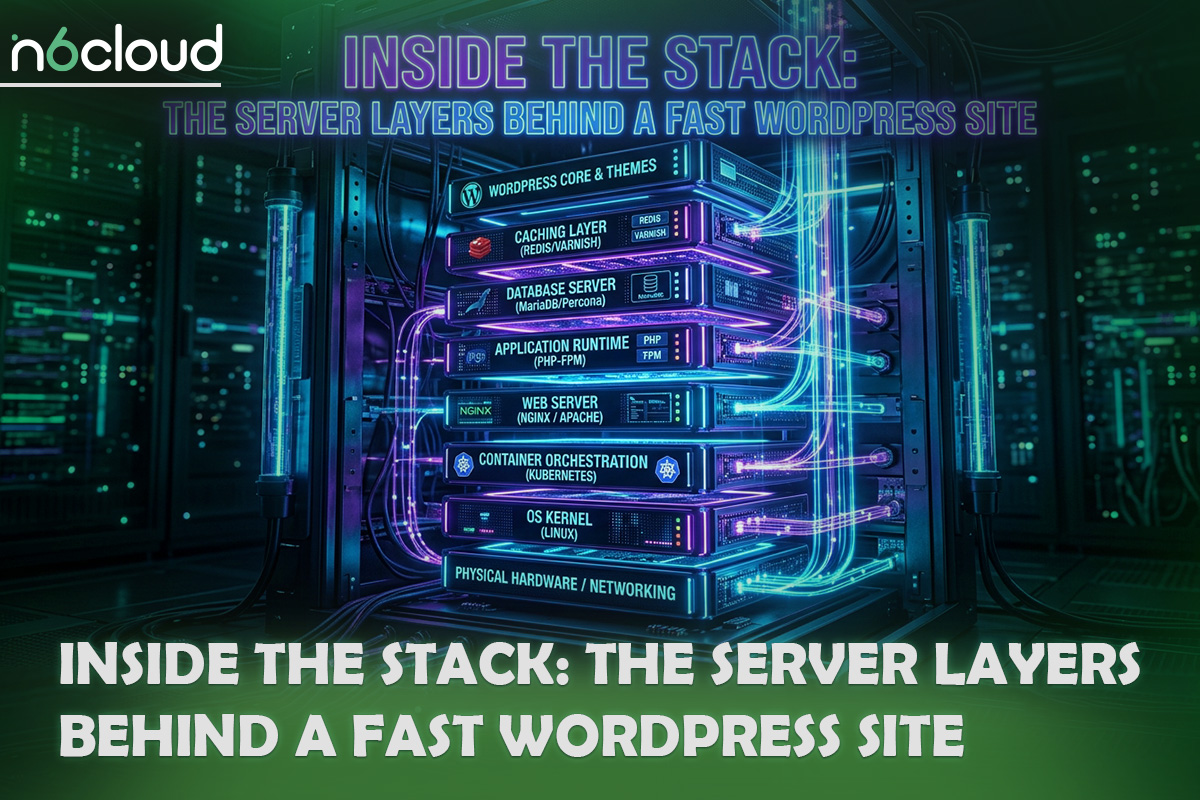
Inside the Stack: The Server Layers Behind a Fast WordPress Site
Once you pick a data centre, the rest depends on the server, where a request meets three layers in order. The network edge opens the connection, the web server answers from its cache or passes the request on, and PHP and the database build the page when nothing is cached. That’s the WordPress server stack.
The Network Edge: DNS, TLS 1.3, and HTTP/3
Modern protocols cut the round trips a new visitor pays. After DNS turns the domain into an IP address (usually cached after the first visit), the browser opens a TCP connection and runs a TLS 1.3 handshake. Those take two round trips, and the request and reply take a third.
QUIC, the newer connection method under HTTP/3, does the connection and encryption in a single round trip, saving about 53 ms from Toronto to British Columbia (BC). A browser usually switches to HTTP/3 only after a response tells it, in a header called alt-svc, that the site offers it, so a first-ever visit usually uses HTTP/2. On a repeat visit, 0-RTT resumption can send the request in the first packet if the server allows it, though an attacker can replay that request, so it’s only safe for requests that change nothing. On the server side, all of this is set up by your host, or by your CDN if you use one, and the browser handles the rest.
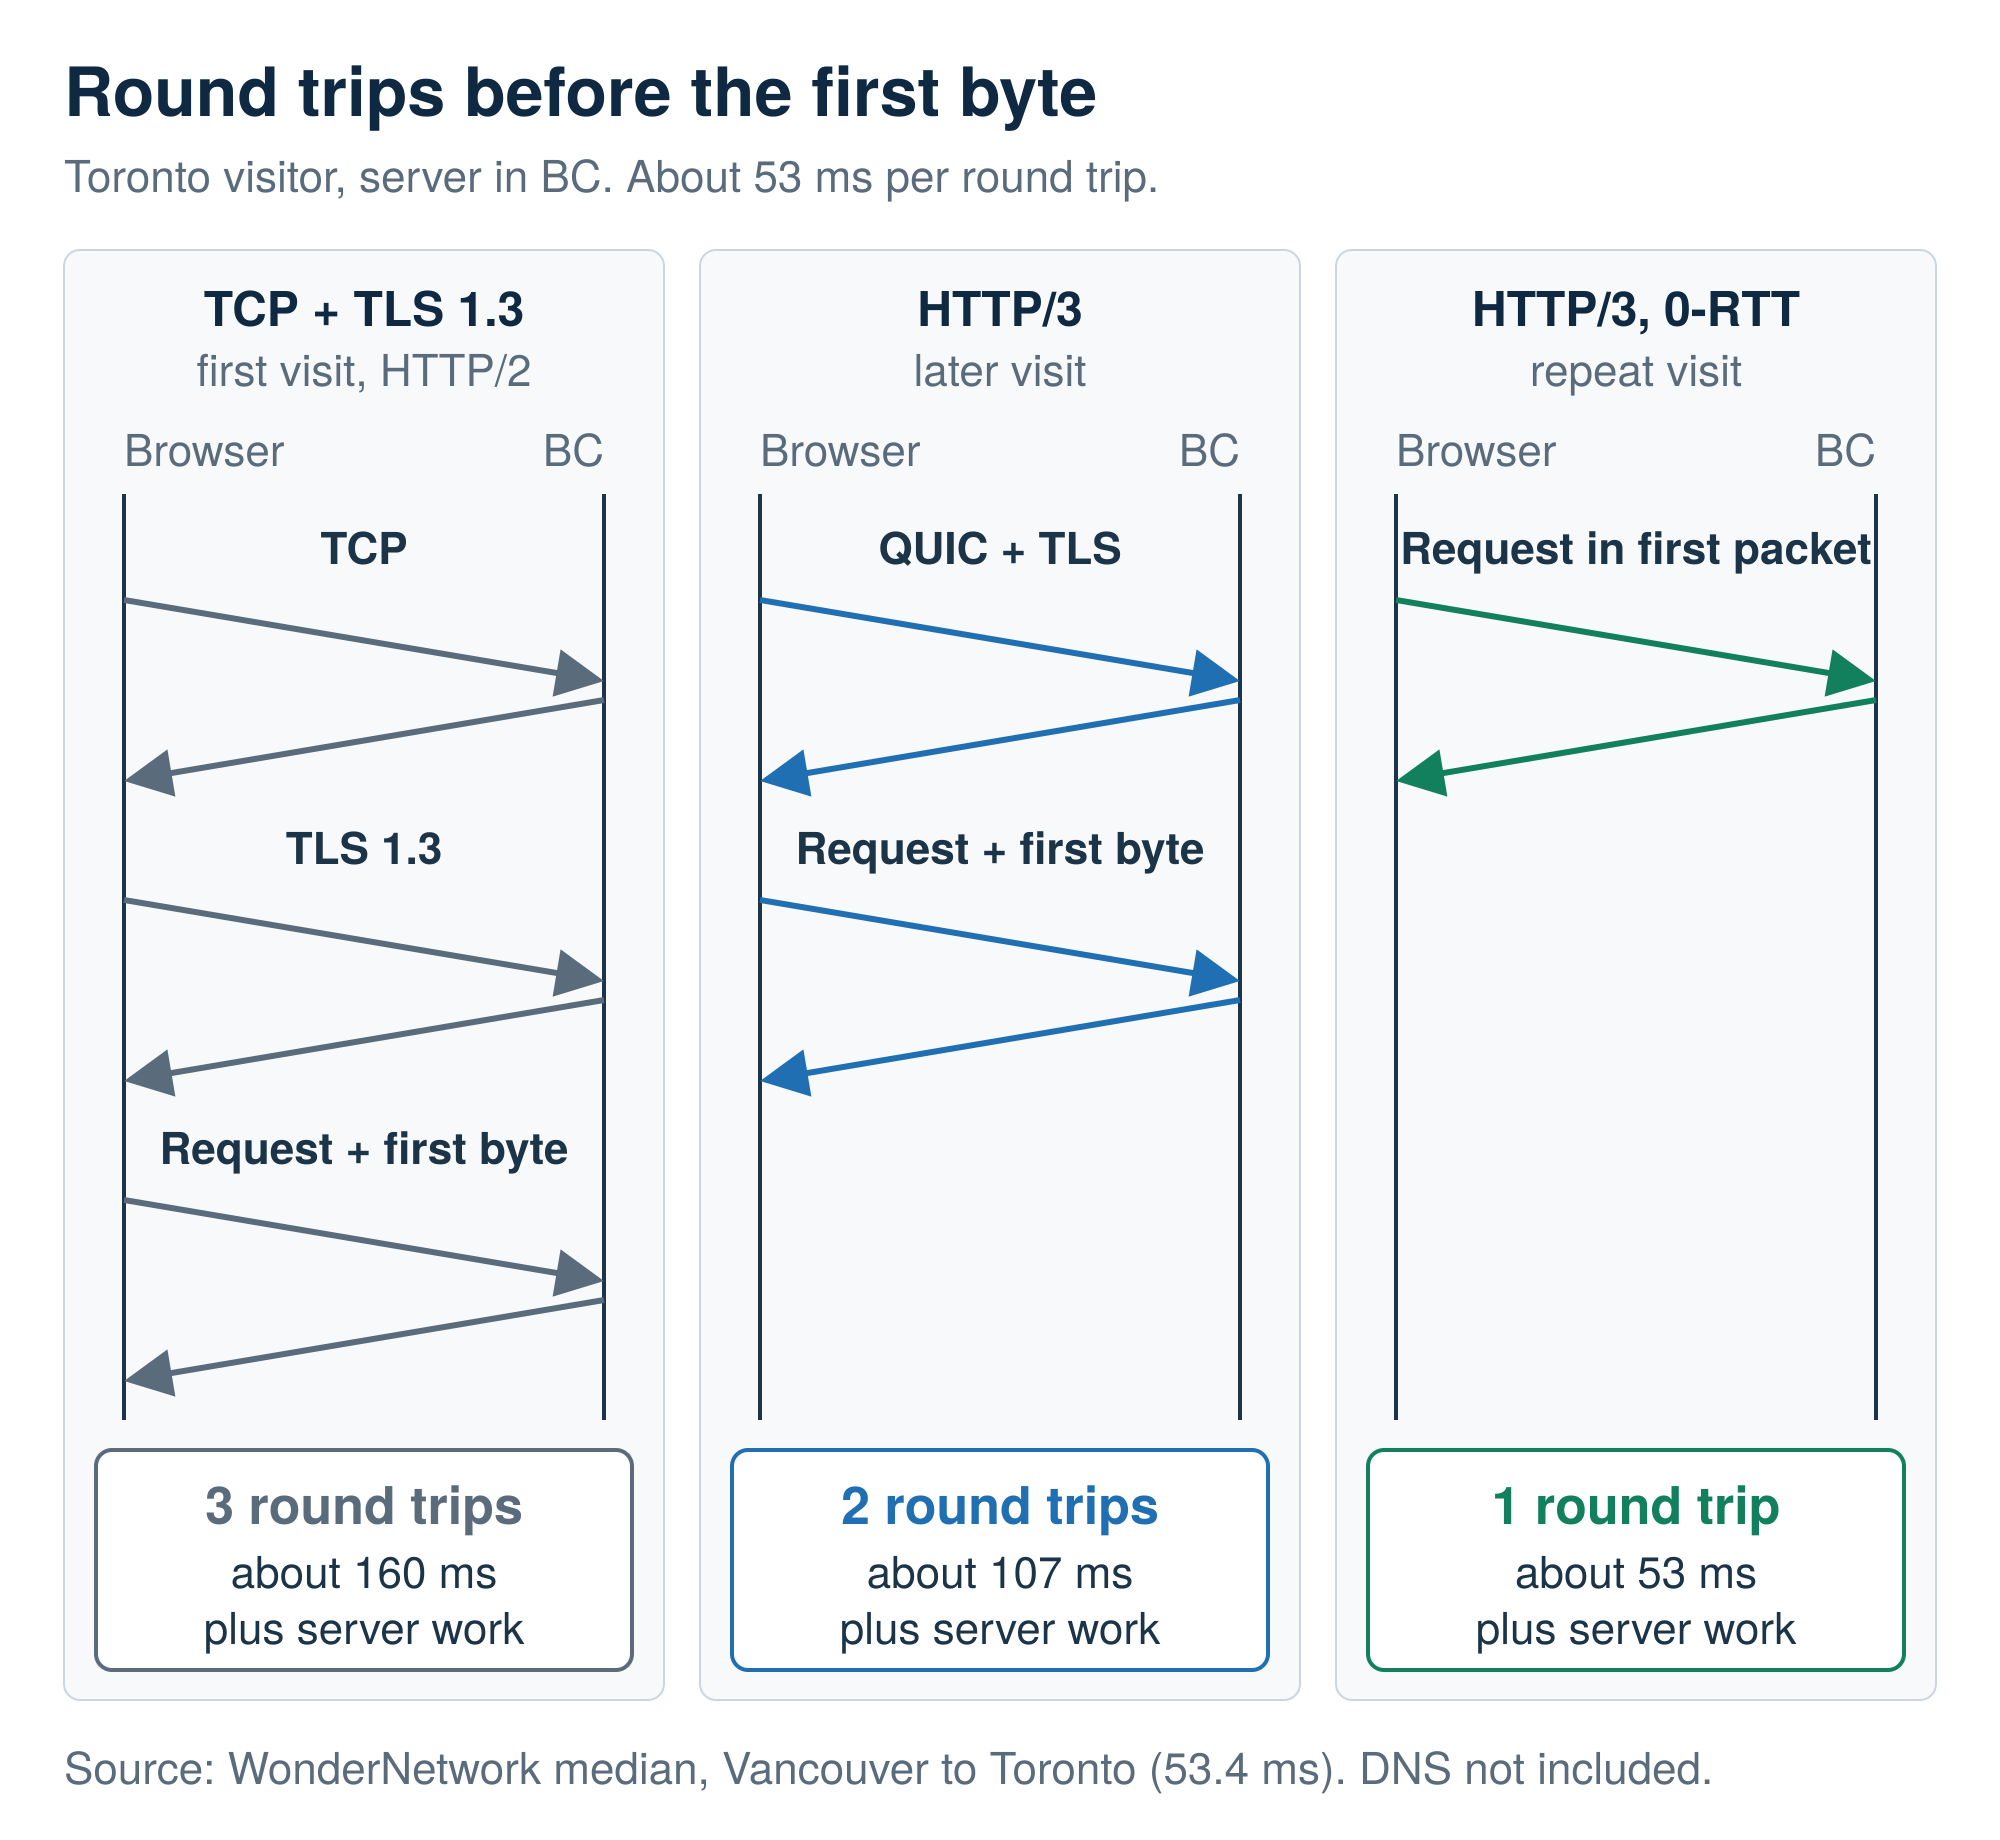
HTTP/3 helps most on shaky mobile connections. Over TCP, one lost packet holds up every file behind it (head-of-line blocking), while QUIC keeps the others moving, and a QUIC connection survives a switch from Wi-Fi to mobile data. No primary source gives a reliable percentage gain, so count on one round trip saved, plus steadier loading on poor networks.
LiteSpeed vs NGINX vs Apache: Why the Cache Matters More Than the Brand
On cached pages, most of LiteSpeed’s lead comes from its built-in WordPress cache rather than the server itself. On uncached pages, no reliable public test shows a big gap between a well-tuned LiteSpeed and NGINX server. Apache is the long-time default: flexible, lets each site change settings with .htaccess files, and heavier per connection unless tuned. NGINX is event-driven and light, often in front of PHP-FPM, the process manager that runs PHP. LiteSpeed is a commercial server that reads Apache’s settings and comes with its own WordPress plugin, LiteSpeed Cache (LSCache).
The speed multipliers in hosting ads tend to come from tests that count requests per second for already-cached pages, between two machines a fraction of a millisecond apart. That matters in a spike but says little about a Halifax visitor’s wait for an uncached page. Weigh any multiplier against the test behind it, and check your host’s server in the response headers section below.
The small public tests point in different directions. A short independent test found no uncached difference, a self-published production test credited most of LiteSpeed’s lead to LSCache, and a store test reported second-hand found NGINX faster uncached. Two of the three used OpenLiteSpeed, LiteSpeed’s free edition. Uncached speed comes down to PHP, OPcache, and the database, which the next section follows step by step.
The Uncached Path: PHP, OPcache, Workers, and the Database
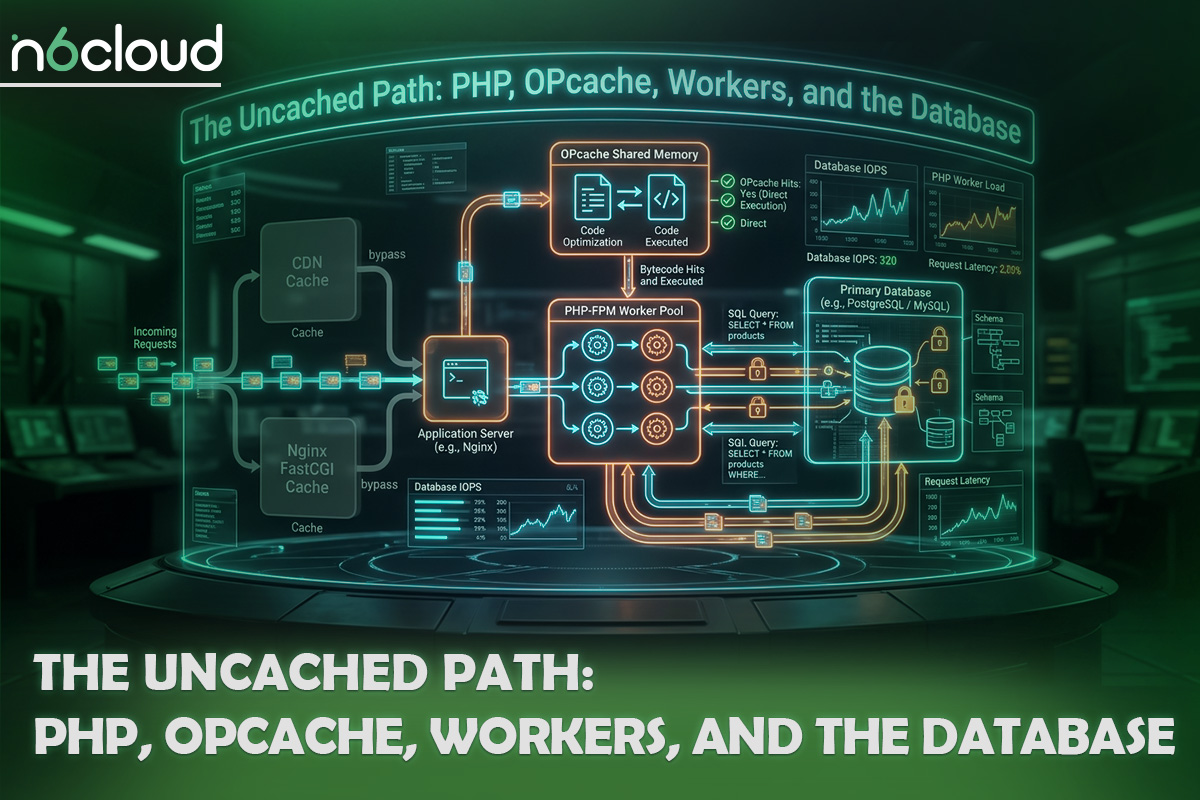
When nothing is cached, WordPress rebuilds the page in PHP and asks the database dozens of questions, so PHP, OPcache, workers, and database memory set the time. PHP loads WordPress, runs plugins and the theme, queries the database, and sends the HTML. It repeats this for every uncached visitor.
The WordPress server requirements recommend PHP 8.3 or newer, but 8.3 has received only security fixes since 31 December 2025, so 8.4 or newer is the better choice where your host offers it. PHP OPcache keeps compiled code in memory to skip parsing. From PHP 8.5 it’s built into PHP, though a server setting can still turn it off, so check that it’s active. In an earlier N6 Cloud test, turning OPcache on cut an uncached cart page from about 1.7 seconds to 1.0 second. Switching the PHP handler (the module that connects the web server to PHP) alone changed nothing measurable.
A PHP worker is one process that builds one uncached page at a time. When all workers are busy, extra uncached requests wait in line, adding to TTFB. Stores feel this first, since carts and checkouts are uncached, and the store guide linked below gives typical worker counts.
The database has its own memory cache: MySQL and MariaDB keep frequently read data in the buffer pool. If the pool can hold the data a site uses most, the site rarely reads from disk. Faster storage helps mostly with writes and with reads that miss the pool, and no disk replaces a cache.
Caching Layers: Where a Sub-Second TTFB Is Won
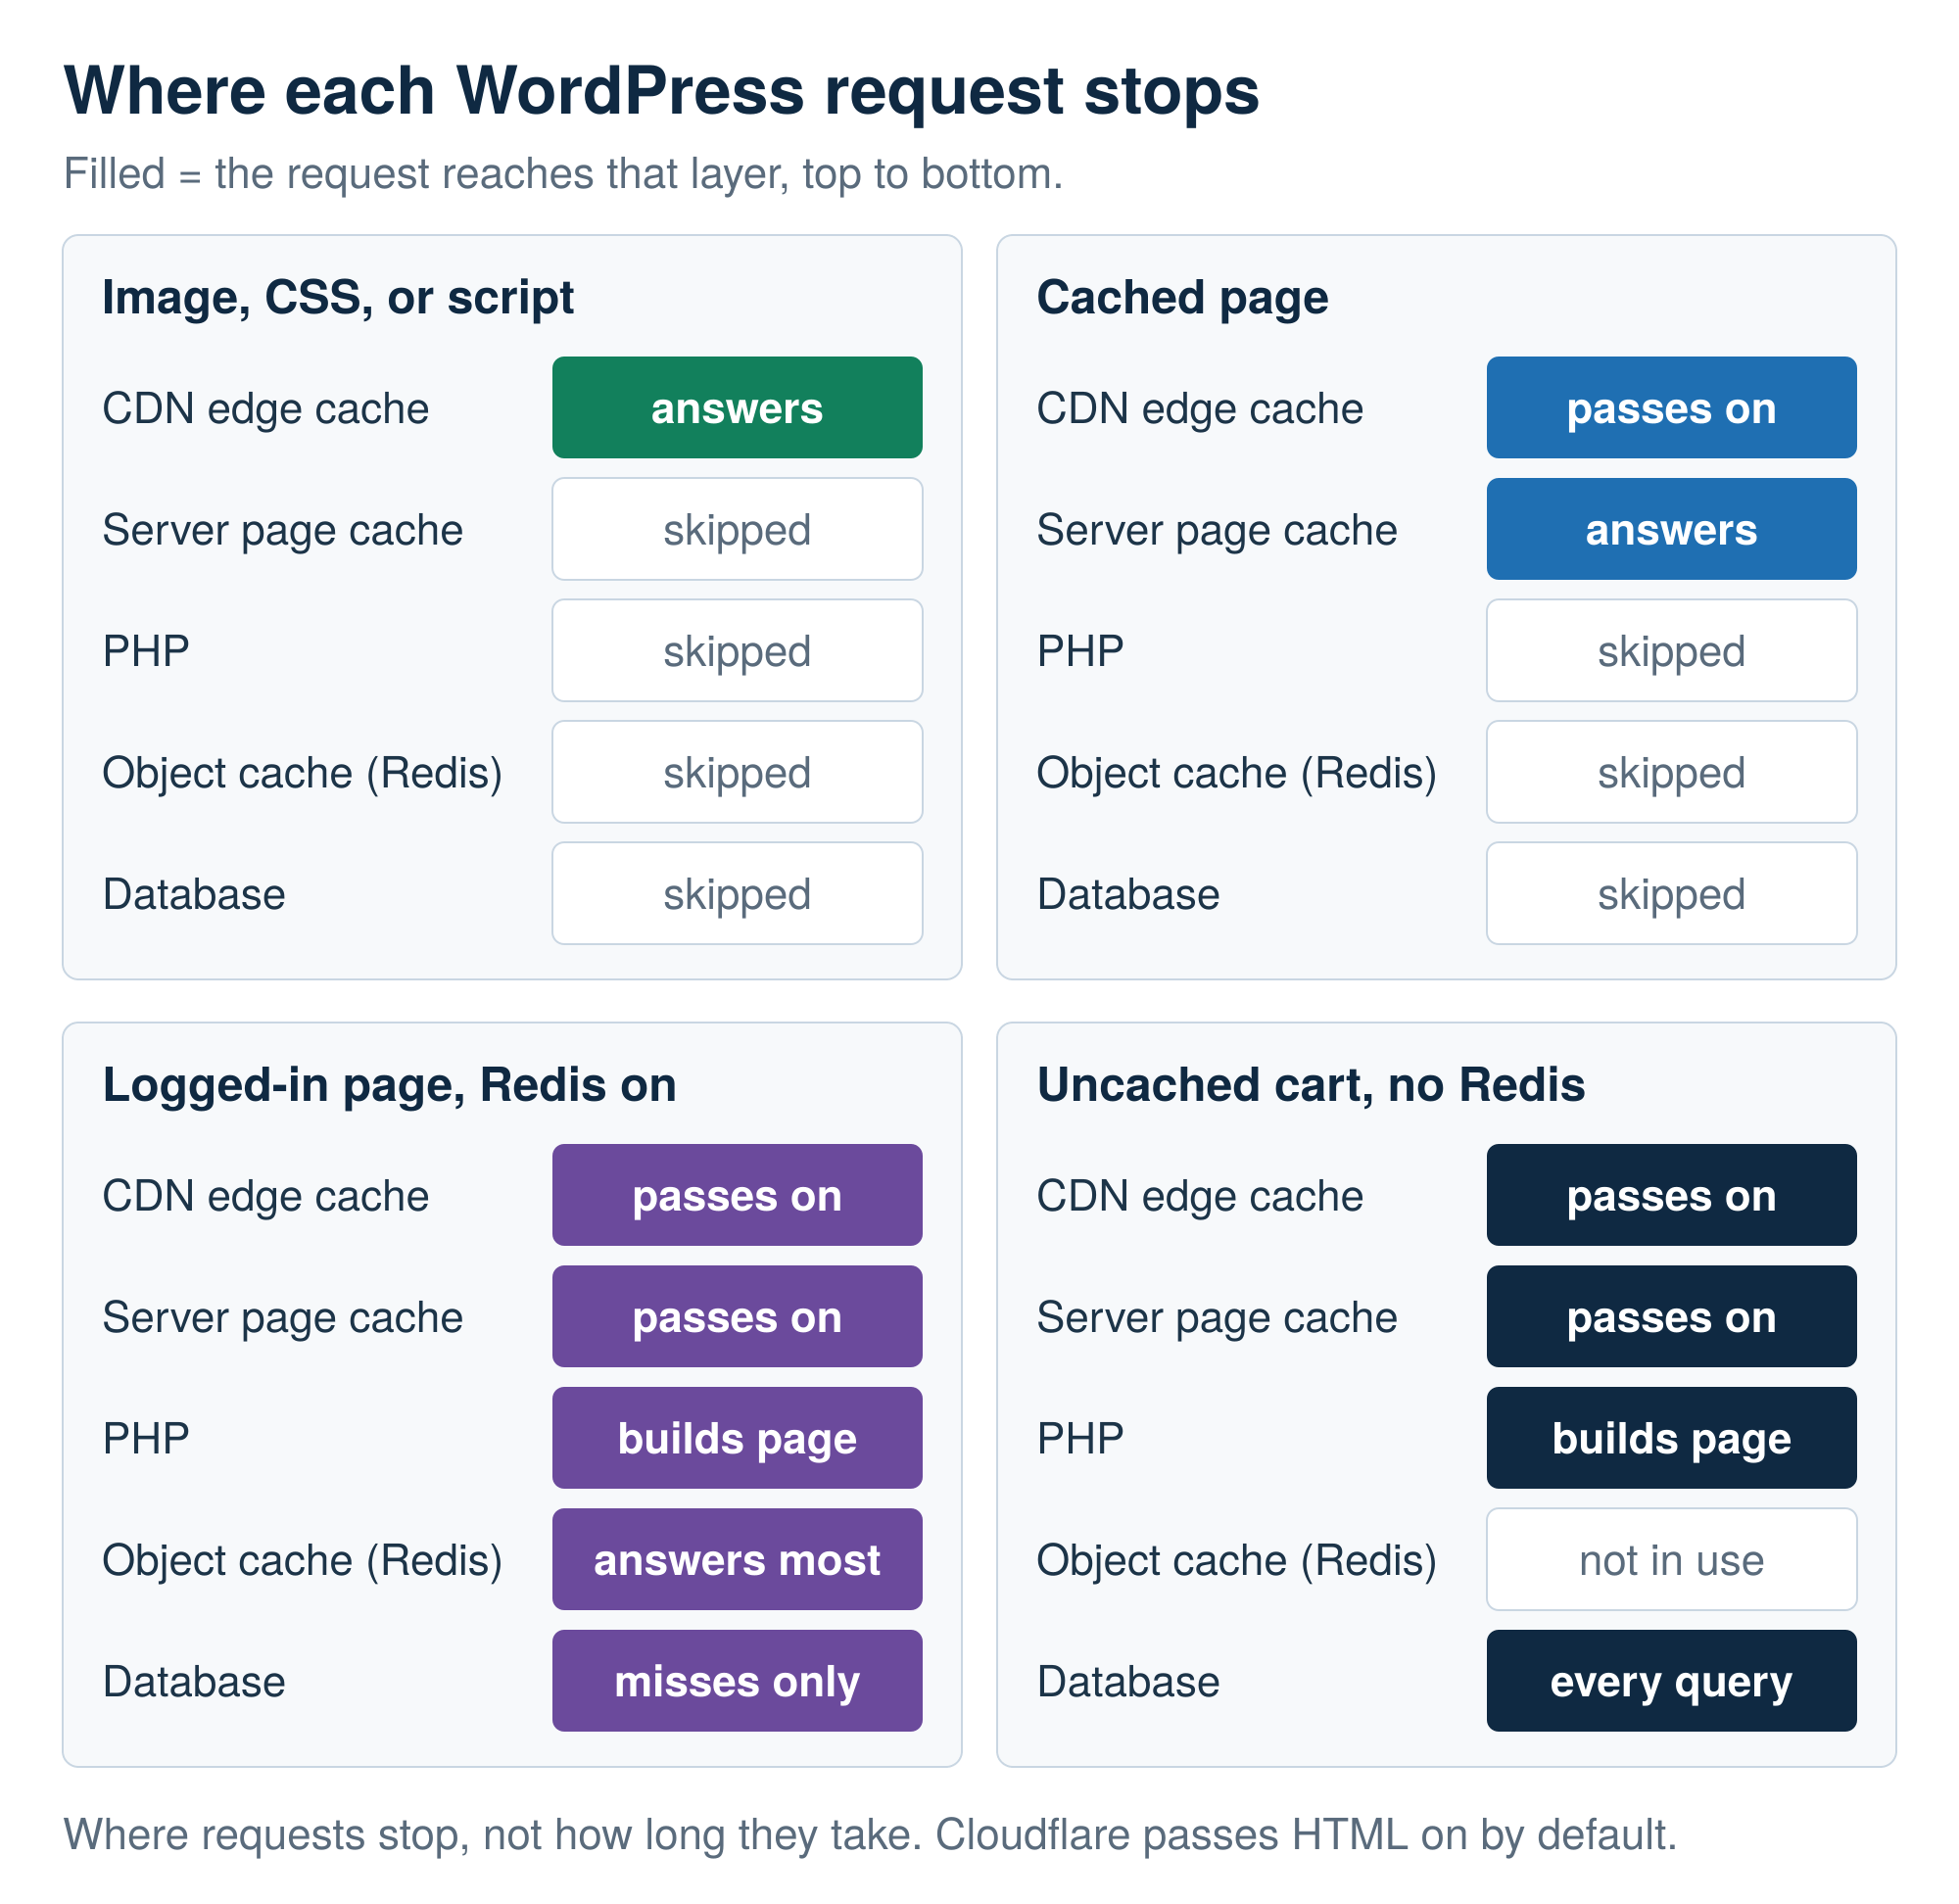
A cache stores a finished answer so the next request skips the uncached path. A cache hit is a request answered from the cache, and a cache miss is one that has to be built. WordPress hosting uses three caches at different distances from the visitor, and Figure 2 shows where each request type stops.
Server-Level Page Cache: LSCache, FastCGI Cache, and Varnish
A server-level page cache returns the finished HTML before PHP starts, which is why it’s usually faster than a cache plugin that runs in PHP on the same server. Many cache plugins still start PHP and load part of WordPress to find their saved copy. A server-level cache answers from the web server, so a hit never touches PHP or the database and takes the server only a few milliseconds. LSCache and NGINX’s FastCGI cache are built into their web servers, while
LSCache takes its orders from a WordPress plugin, which tells it what to clear when you edit content. It tags each cached page by the post, product, or archive it shows. An edit clears that page and related pages that list it, such as the homepage and category archives, rather than the whole cache. A guide with every LiteSpeed Cache setting explained walks through the plugin’s options.
NGINX has its own page cache, FastCGI cache, set up with NGINX’s fastcgi_cache directives, which stores PHP’s output and serves it on the next request. NGINX doesn’t know when a WordPress post changes, though, so clearing the right pages needs a helper plugin and extra server rules. That extra setup, more than raw speed, is where most of LSCache’s advantage comes from.

Redis Object Cache for Logged-In Users and WooCommerce
When the page cache can’t help, as with logged-in users, carts, and wp-admin, a persistent object cache such as Redis stops WordPress from asking the database the same questions on every request. WordPress’s built-in object cache keeps query results only until the request ends, so the next one starts empty. Without a persistent cache, every uncached request runs these two kinds of query from WordPress core, shown here as they appear in the code:
How N6 Cloud tested: a clean WordPress install with the default theme, 30 sample posts, and LiteSpeed Cache on default settings. Globalping’s public probes on data-centre networks in Toronto and Vancouver sent requests straight to the server, 10 runs per cell (5 purge cycles for the cold cell). Requests used HTTPS over TCP, not HTTP/3, and no DNS lookup was timed. Limits: one simple test site, one session, and no concurrent visitors, so a real store will add uncached time.
Every median in Table 2 stays under web.dev’s 0.8-second mark, so a sub-second TTFB held in both cities, cached or not. Even the slowest Toronto median, 415 ms after a purge, comes to about 535 ms with a new connection’s 120 ms added, which leaves room for a DNS lookup. It sits near the top of its range because three of the five runs took 415 to 418 ms, and only one, at 321 ms, was much faster. One uncached Toronto run took 1,432 ms, the first of its series, likely a PHP process starting cold. The median sets it aside, though a visitor then waits the full time.
Under load, uncached speed depends on the CPU, memory, and processes your account gets. On shared servers, CloudLinux resource limits (set by the server operating system many hosts use) give each account its own share, so a busy neighbour can’t use up yours. A VPS reserves a set amount of CPU and memory for your server alone, even on hardware shared with other virtual servers. At a limit, your site’s requests slow down or, at the process limit, get an error page, while other sites carry on. To tell whether your site is hitting them, the guide to what CPU, memory, and process limits do explains each limit and the error it causes.
How to Check Any Host’s Stack Yourself in 10 Minutes
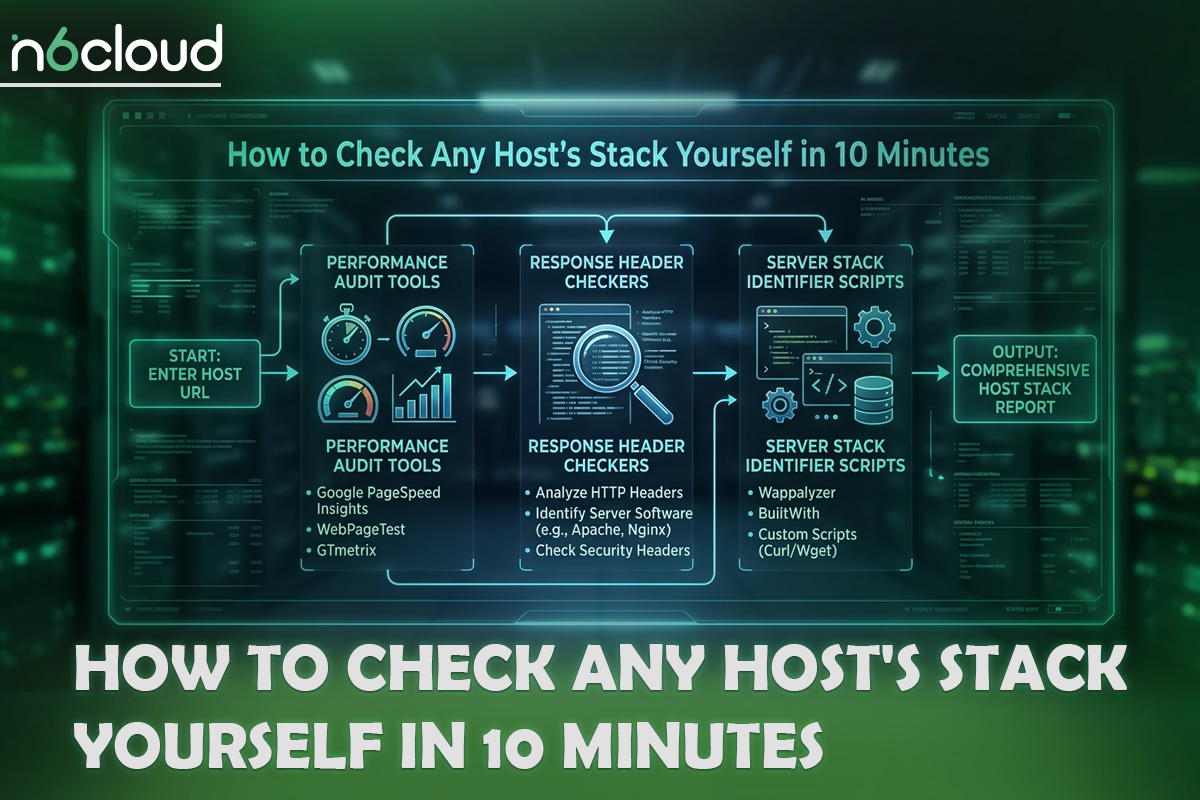
You don’t have to take any host’s word for its stack, N6 Cloud’s included. Three checks show it in about 10 minutes: the headers, a timing test, and your own slow pages. Your browser’s developer tools and curl, a command-line tool built into Windows 10 and 11, macOS, and Linux, are all you need. They work on any host, including one you’re thinking of leaving.
Read the Response Headers: server, x-litespeed-cache, cf-cache-status
Three headers show which web server answered, whether its page cache was hit, and whether a CDN cached the page. In Chrome, Edge, or Firefox, open the developer tools’ Network tab, reload, click the first entry, and open Headers. In Windows PowerShell or Command Prompt, curl.exe -sI https://example.com/ prints them (on macOS or Linux, type curl without .exe). Below are N6 Cloud’s homepage and its test site with a unique query string, trimmed.
This sample ran from a BC server to N6 Cloud’s test site, through Cloudflare, uncached. Each number counts from the start, so connect to tls (about 30 ms here) is the TLS handshake, which happens with Cloudflare’s nearby edge. The gap from tls to first byte (about 0.42 seconds) is the rest: the trip to the edge, Cloudflare’s fetch from the server, and the server building the page. On a site without a CDN in front, that gap is server work plus one round trip, so to time the host alone, test a URL that doesn’t go through a CDN. For other cities, try a free probe network such as Globalping. If the uncached URL’s median stays under web.dev’s 0.8 seconds from your visitors’ cities, the stack is fast enough for them.
Your own slow pages need one more check. In a private window, open a page that should be cached, then log in, add an item to your cart, and open the cart and a wp-admin screen, all with the Network tab open. Click the first document request, open Timing, and note “Waiting for server response” (“Waiting” in Firefox) over a few reloads. If the cached page is slow from a nearby city, the host or the distance to it is the likely cause. If the cached page is quick but the cart or dashboard is slow, the uncached path is the bottleneck: your plugins, theme, and database, or the PHP resources your plan gives you. With LiteSpeed Cache, a missing x-litespeed-cache header means its page cache didn’t serve that page. Some other cache plugins mark a cached page only with a comment at the end of the page source.
What a hosting spec sheet should tell you
Before you compare hosts on speed, check that each spec sheet states these three things in plain numbers or names:
- The page cache that runs on the server, named (LSCache, FastCGI cache, or Varnish), rather than “caching included”
- The PHP versions you can choose, including 8.4 or newer
- How much CPU and memory each account gets, and how many processes it can run
Why Trust N6 Cloud on WordPress Hosting Speed?
N6 Cloud can be checked against those layers too. It’s a Canadian company based in British Columbia, run by a team with more than 20 years in web hosting. Its servers sit in Canadian data centres in British Columbia, which keeps the round trips from the budget above short for visitors across Canada. Table 2 already shows how one of N6 Cloud’s LiteSpeed WordPress accounts behaves.
Each of these layers is listed on N6 Cloud’s product pages. LiteSpeed Web Server with LiteSpeed Cache runs on N6 Cloud’s LiteSpeed WordPress plans and on every Managed WordPress plan, with HTTP/3 on those plans. OPcache is on by default for new WordPress and Managed WordPress accounts, and Redis object caching is included on every Managed WordPress plan. Sites run on SSD SAN storage with RAID 10, the plans work with Cloudflare’s free CDN, and backups run daily. CloudLinux LVE and CageFS keep each account’s resources and files separate, Imunify360 scans for malware, and a 99.9% uptime commitment backs it all.
If you’re choosing WordPress hosting, run the header and timing checks from the previous section on N6 Cloud’s pages, as you would on any other host. The results, not a spec sheet, show which is the fastest WordPress hosting for your visitors. When you’ve seen them, the 24/7 support team can help you match a plan to a blog, a membership site, or a store.